Amazon Brand Dashboard
An AI-powered conversational analytics platform that transforms complex data into instant insights through natural language queries—enabling brands to make data-driven decisions 30% faster. Built this 0-to-1 product from concept to launch.
Role
Sr. UX Designer
Timeline
4 months
Platform
Web

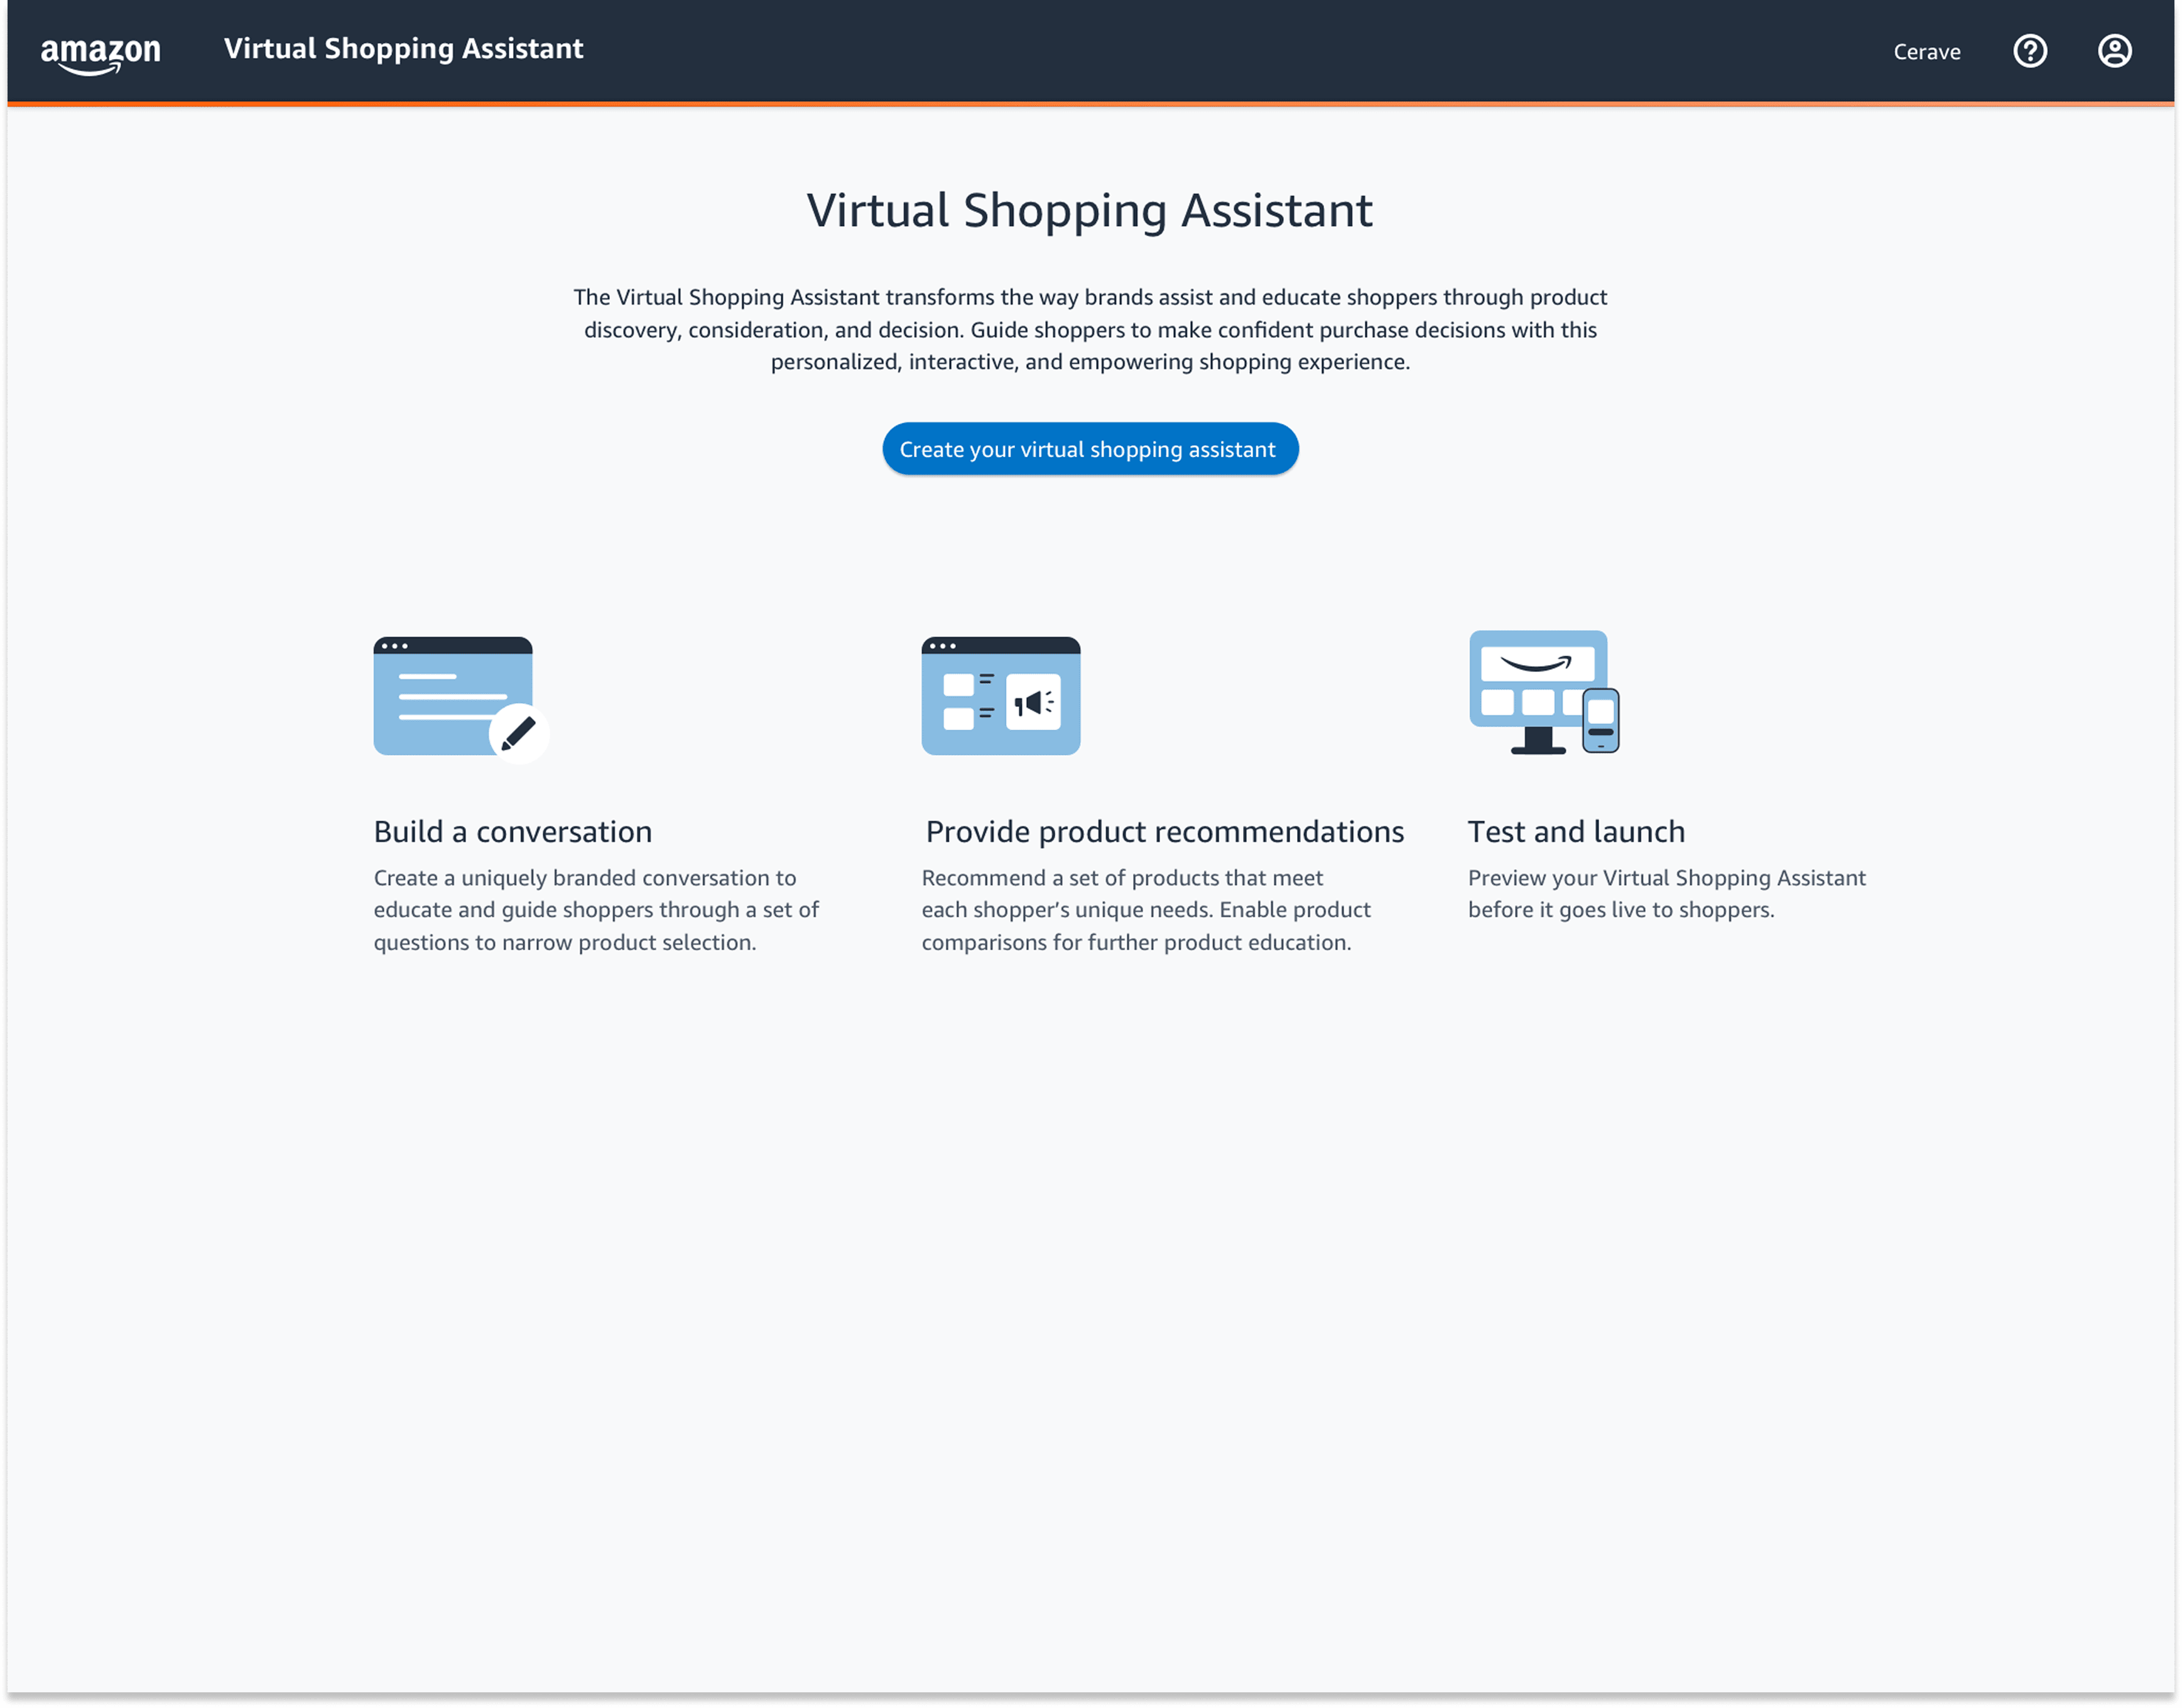
Project Overview
Design and build an Amazon Brand Console dashboard that powers a guided-shopping assistant for brand partners.
My Responsibilities:
Stakeholder & UX Research: Led workshops with marketing, brand management, and e-commerce teams to align on success metrics.
Information Architecture: Defined user flows and feature prioritization for both brand users and end shoppers.
Wireframing & Prototyping: Created low- and high-fidelity designs in Figma, iterating rapidly based on stakeholder and usability feedback.
Data Visualization: Designed interactive charts, tables, and filters to surface key KPIs (sales performance, shopper engagement, product affinity).
Collaboration with Engineering: Partnered with data engineers to translate dashboard specs into actionable API endpoints and ensure data accuracy.
Usability Testing & Iteration: Ran two rounds of moderated testing with 7 brand managers, distilled feedback into design refinements.

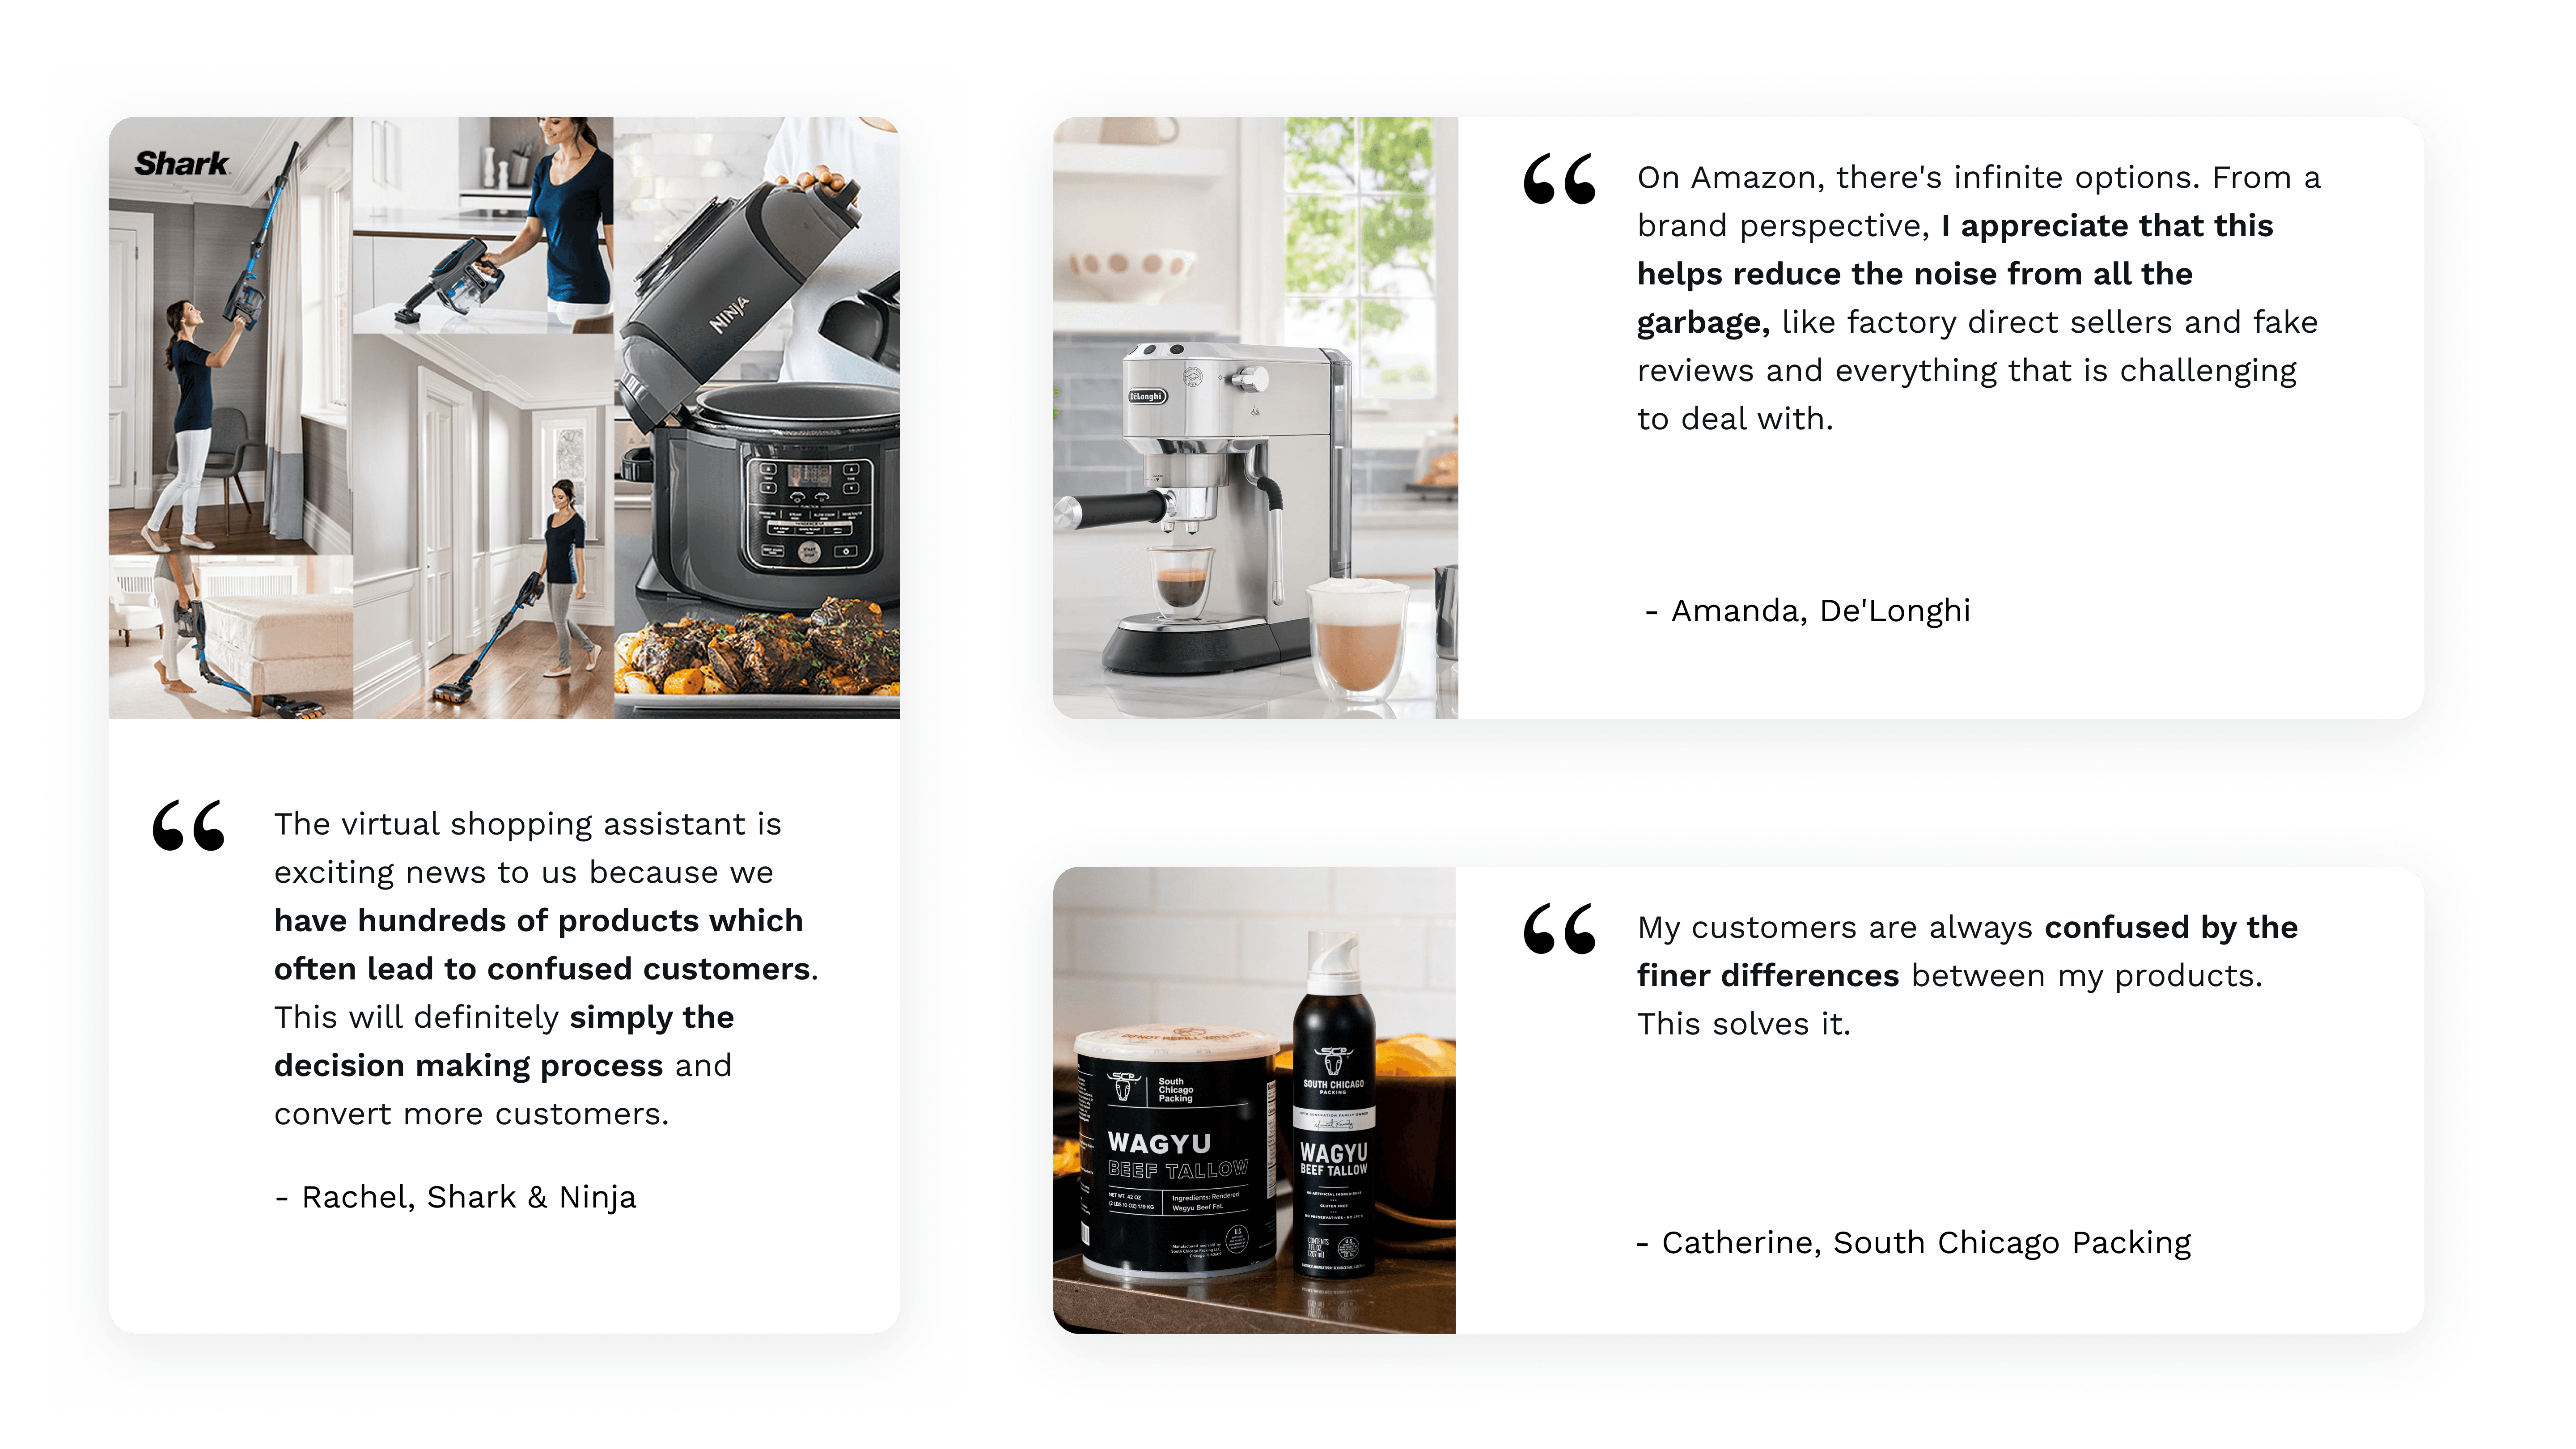
Problem
Brands pour significant marketing dollars into Amazon to build loyalty—but:
Their carefully crafted messaging is drowned out by countless knock-off listings.
Shoppers struggle to find the right product variant amid hundreds of similar SKUs.
Complex items (e.g. supplements, beauty devices) require education before purchase.
Goal
Reassert Brand Voice. Give brands a centralized space to showcase official products, hero messages, and value propositions.
Optimize Assortment. Help merchants identify and promote their top-performing SKUs while sunsetting under-performers.
Educate Shoppers. Surface targeted educational content and guided flows to build confidence with complex or new product lines.
Drive Revenue. Increase basket size, repeat purchases, and average order value by guiding consumers to the right items, faster.

Research
Methodology:
Conducted 7 in-depth interviews with Amazon brand managers, marketing directors, and e-comm leads.
Reviewed existing analytics (search funnels, PDP bounce rates) to quantify drop-off points.
Mapped out competitor Brand Store features to benchmark customization and performance tracking.
Key Pain Points:
Limited Storefront Flexibility. Inability to A/B test hero modules or reorder product carousels.
Insufficient Data. No easy way to see which SKUs drive the most “Add to Cart” clicks or repeat visits.
Customer Education Gap. Shoppers abandon complex products when they lack in-context guidance.
Revenue Optimization. Brands want real-time recommendations on up-sell/cross-sell strategies.
New Line Adoption. Difficulty measuring early traction for new flavors, bundles, or seasonal releases.
Research Goals:
Build a data framework to automatically surface high-impact products for promotion.
Uncover which UI elements (images, videos, comparison tables) generate the highest engagement.
Prioritize features that directly map to revenue uplift (e.g. coupon placement, guided flows).
Competitive Landscape
Across four leading guided-shopping and quiz-builder tools we evaluated, common strengths include drag-and-drop question builders, conditional logic for personalized paths, and basic outcome-to-product mapping. However, they often fall short on:
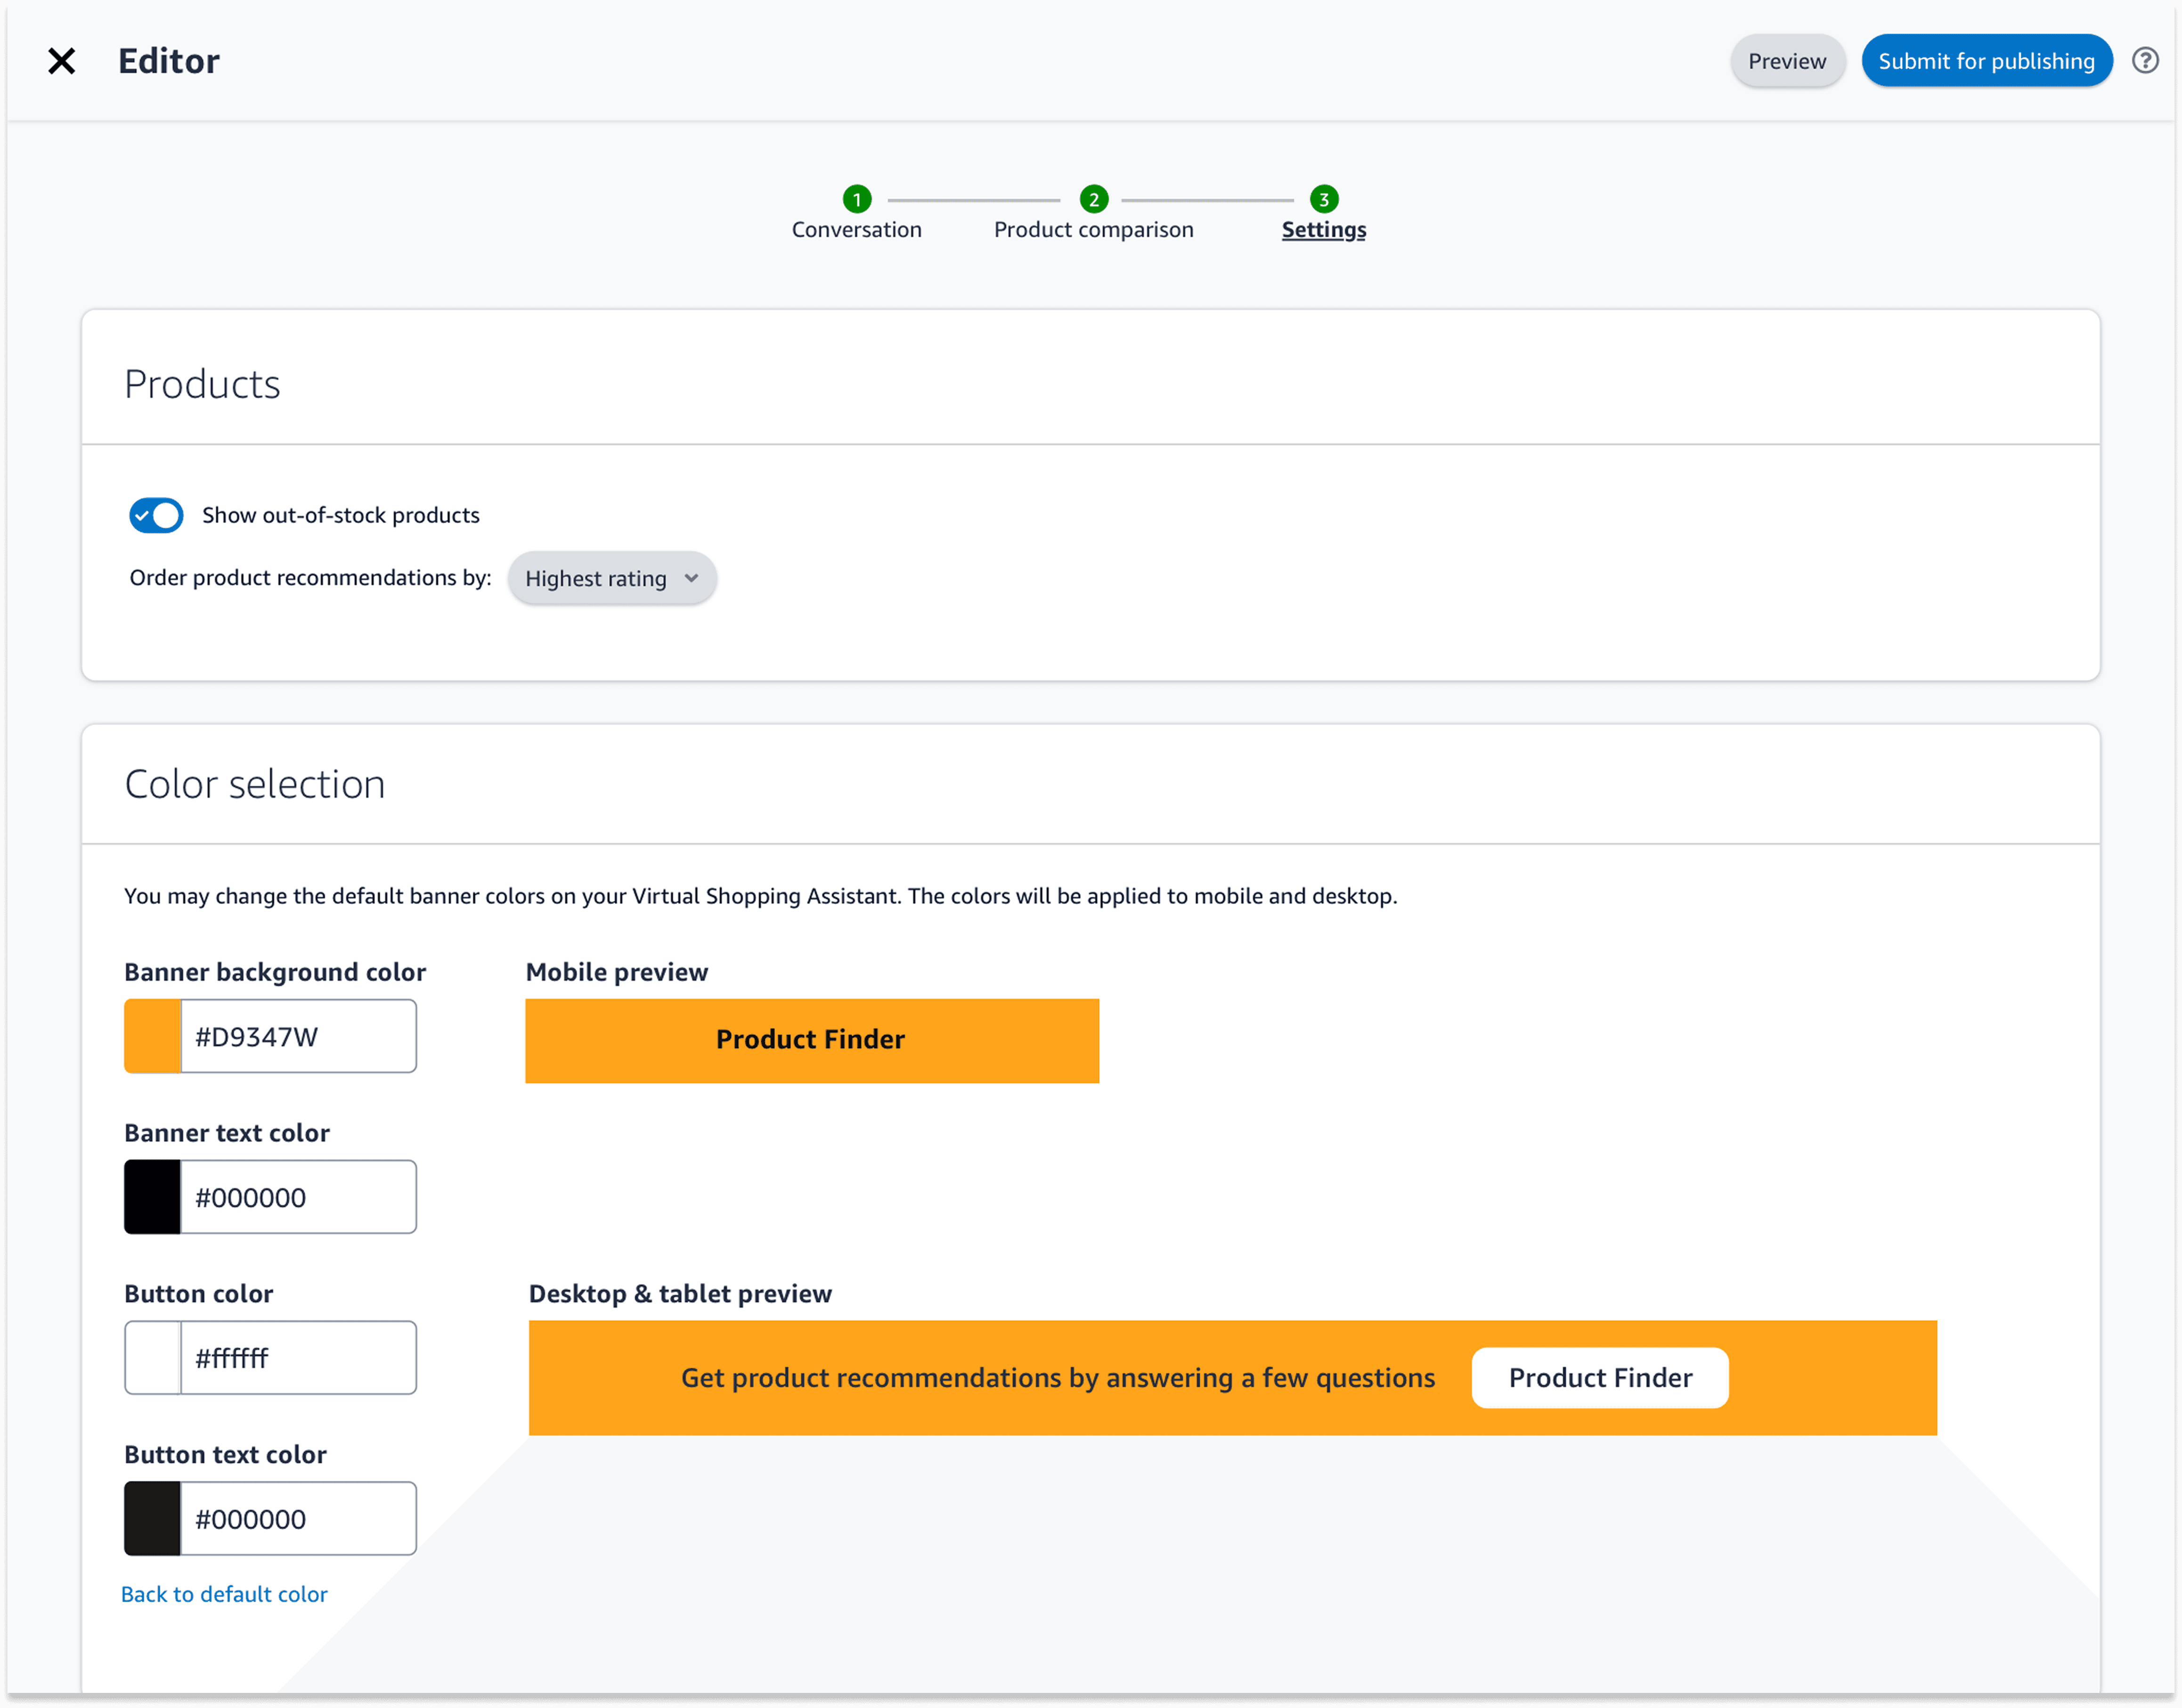
Branding & Customization: Limited ability to match quiz UI to a brand’s look and feel without developer help.
Real-Time Analytics: Minimal in-platform dashboards for tracking engagement, completion rates, or SKU-level performance.
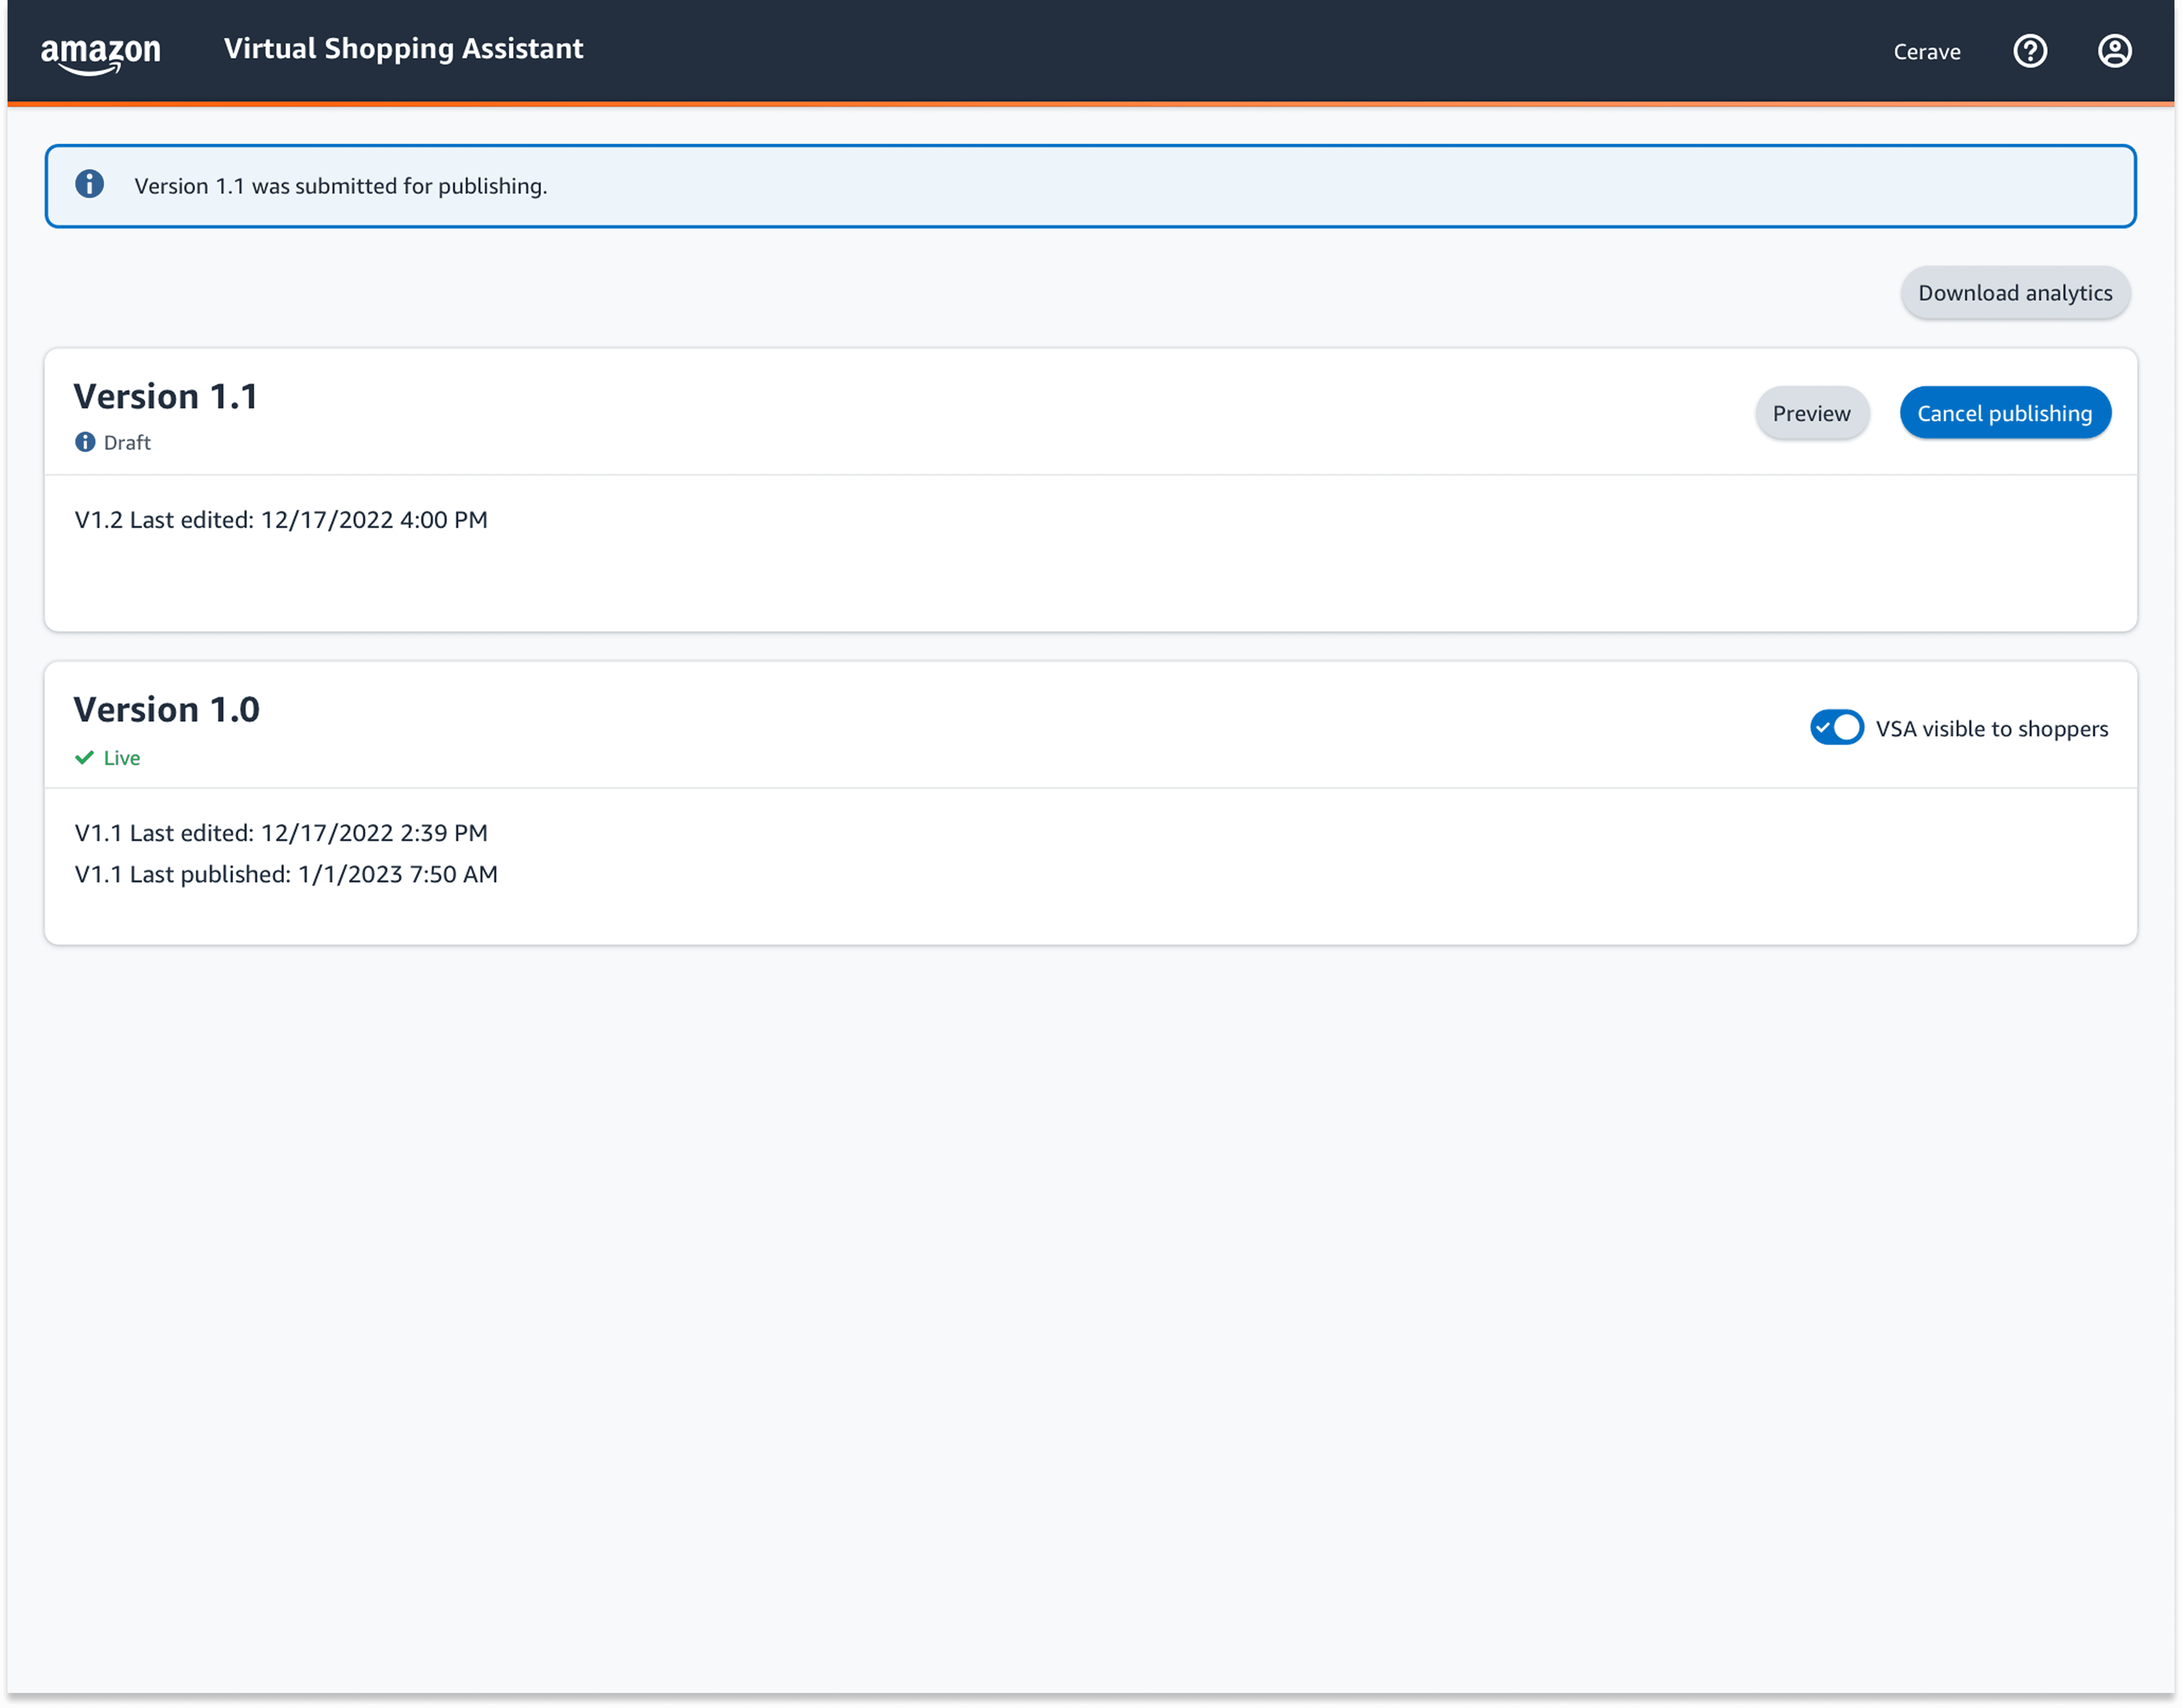
Self-Service Publishing: Most solutions require manual setup or engineering support to push live updates.
Our console differentiates itself by offering turnkey brand styling, built-in performance insights, and a one-click publish workflow—empowering brands to launch, measure, and optimize guided shopping quizzes entirely on their own.

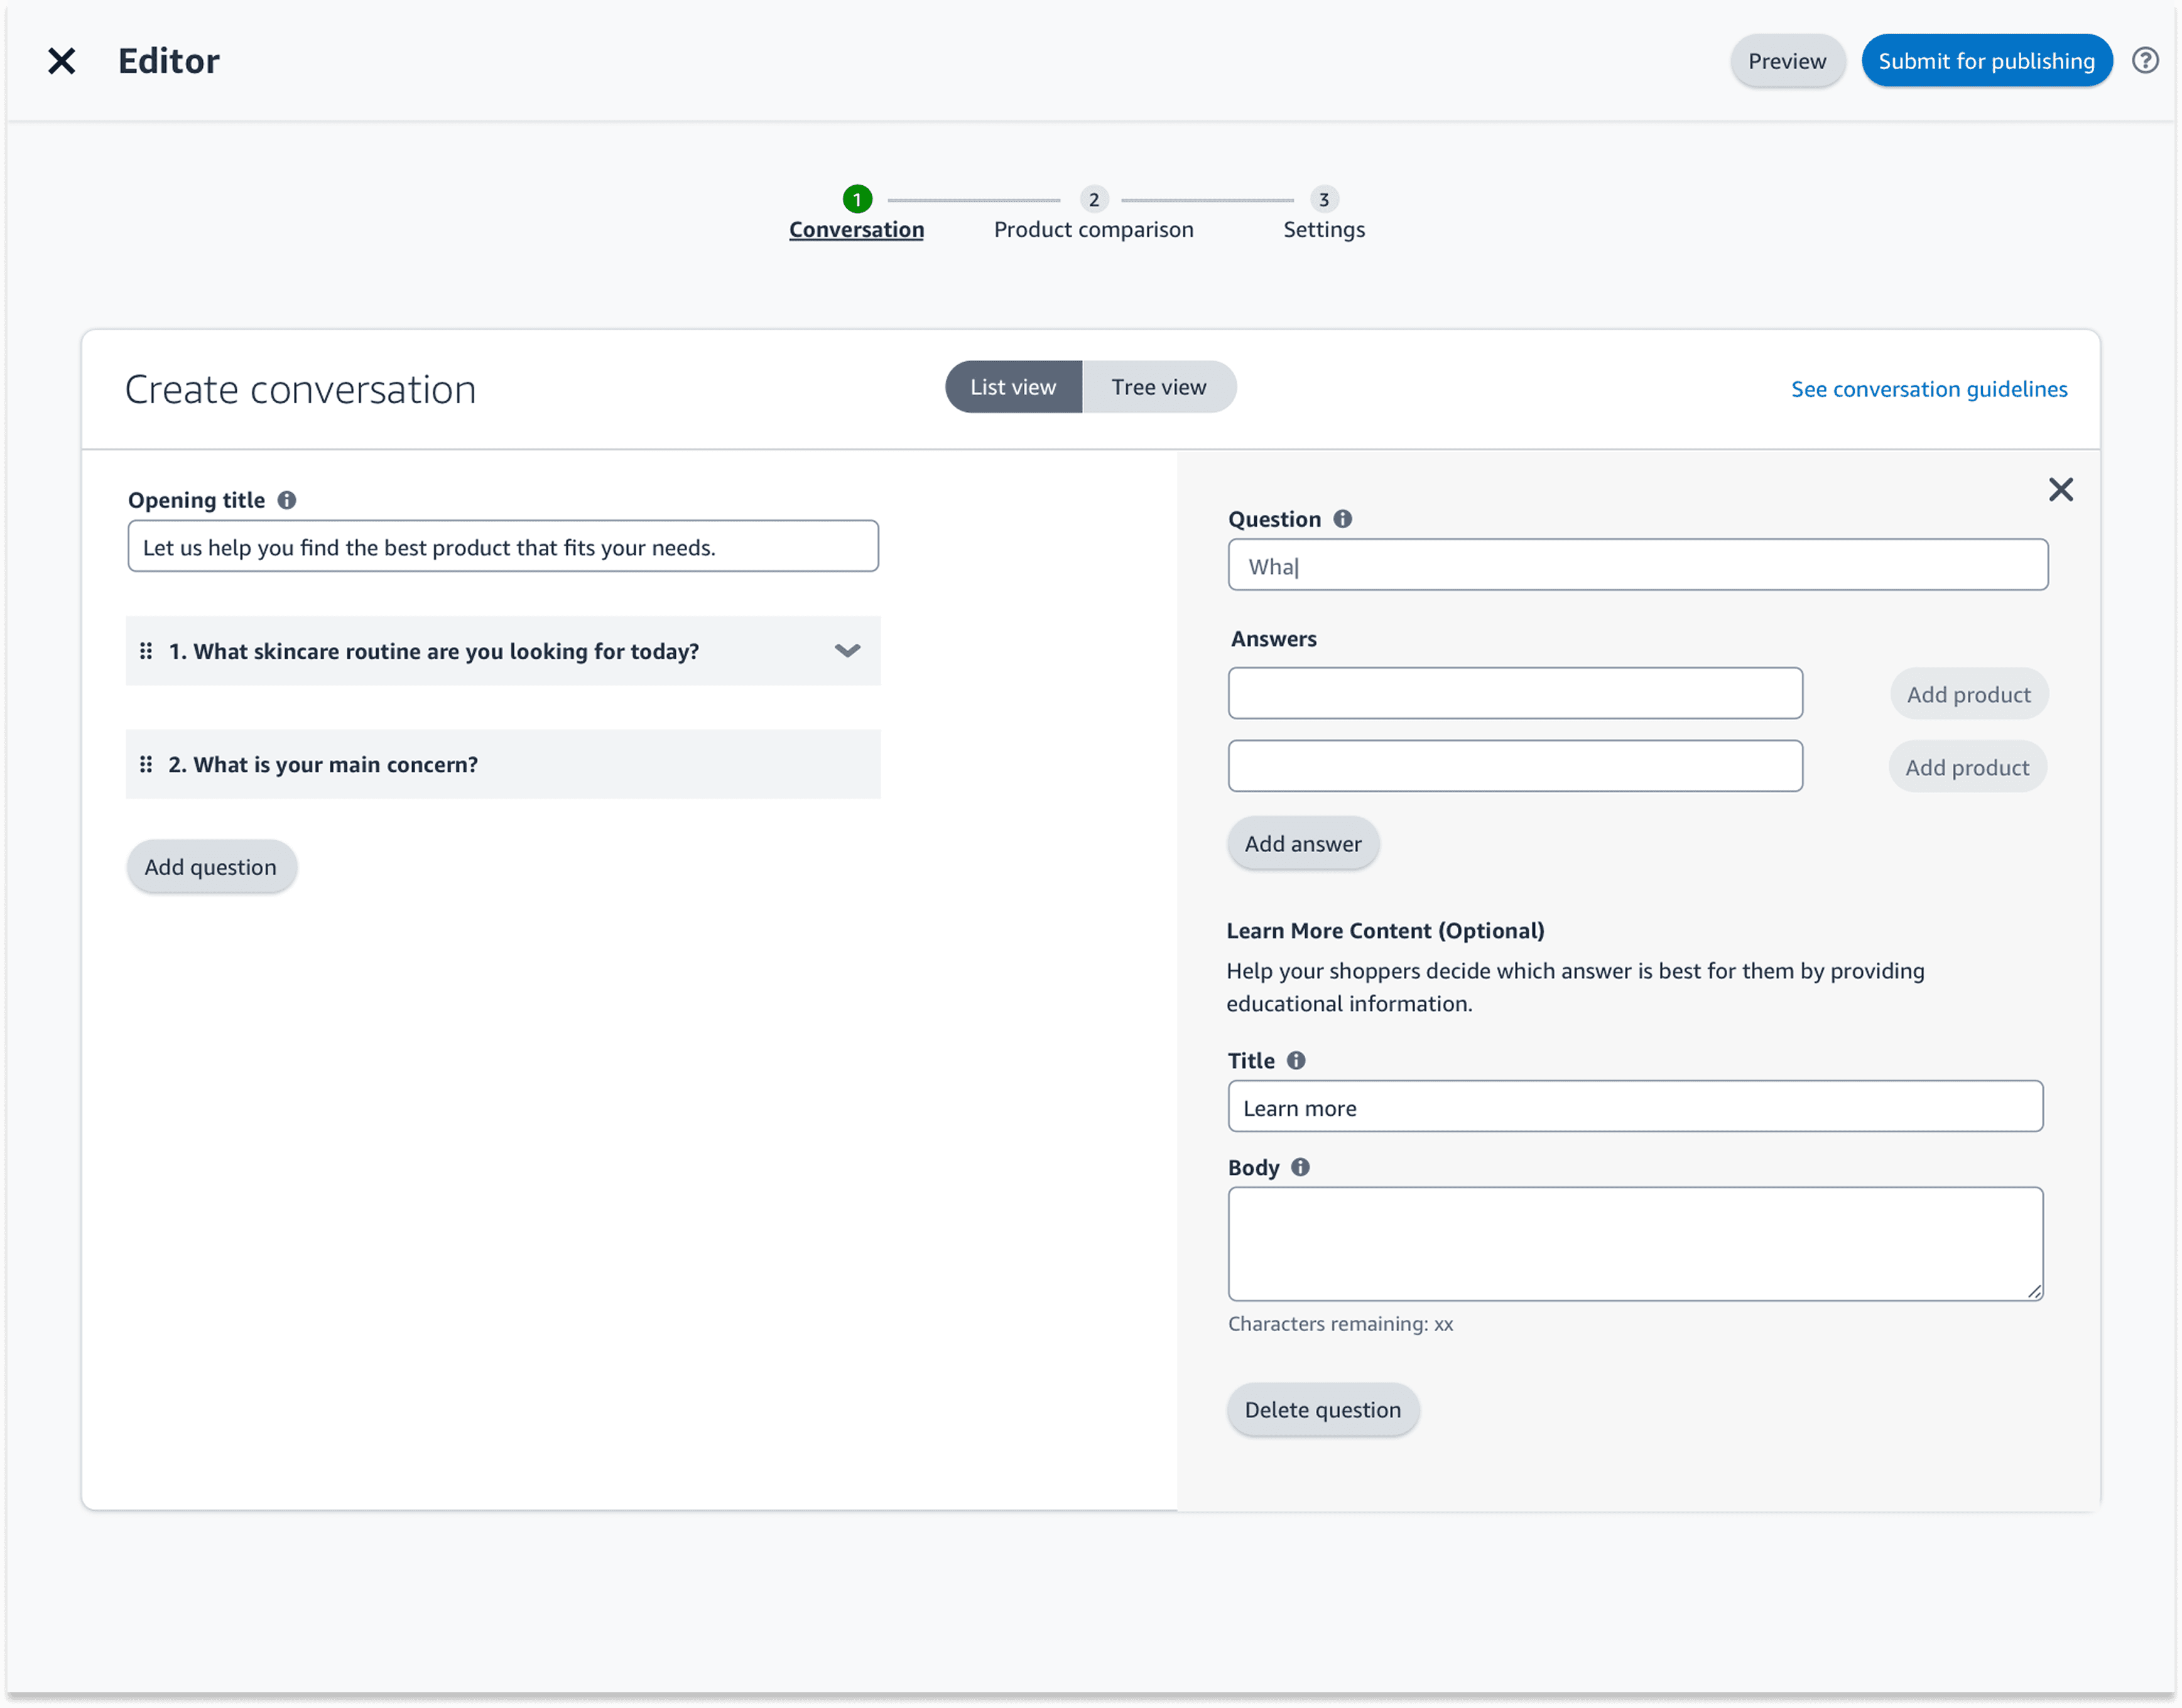
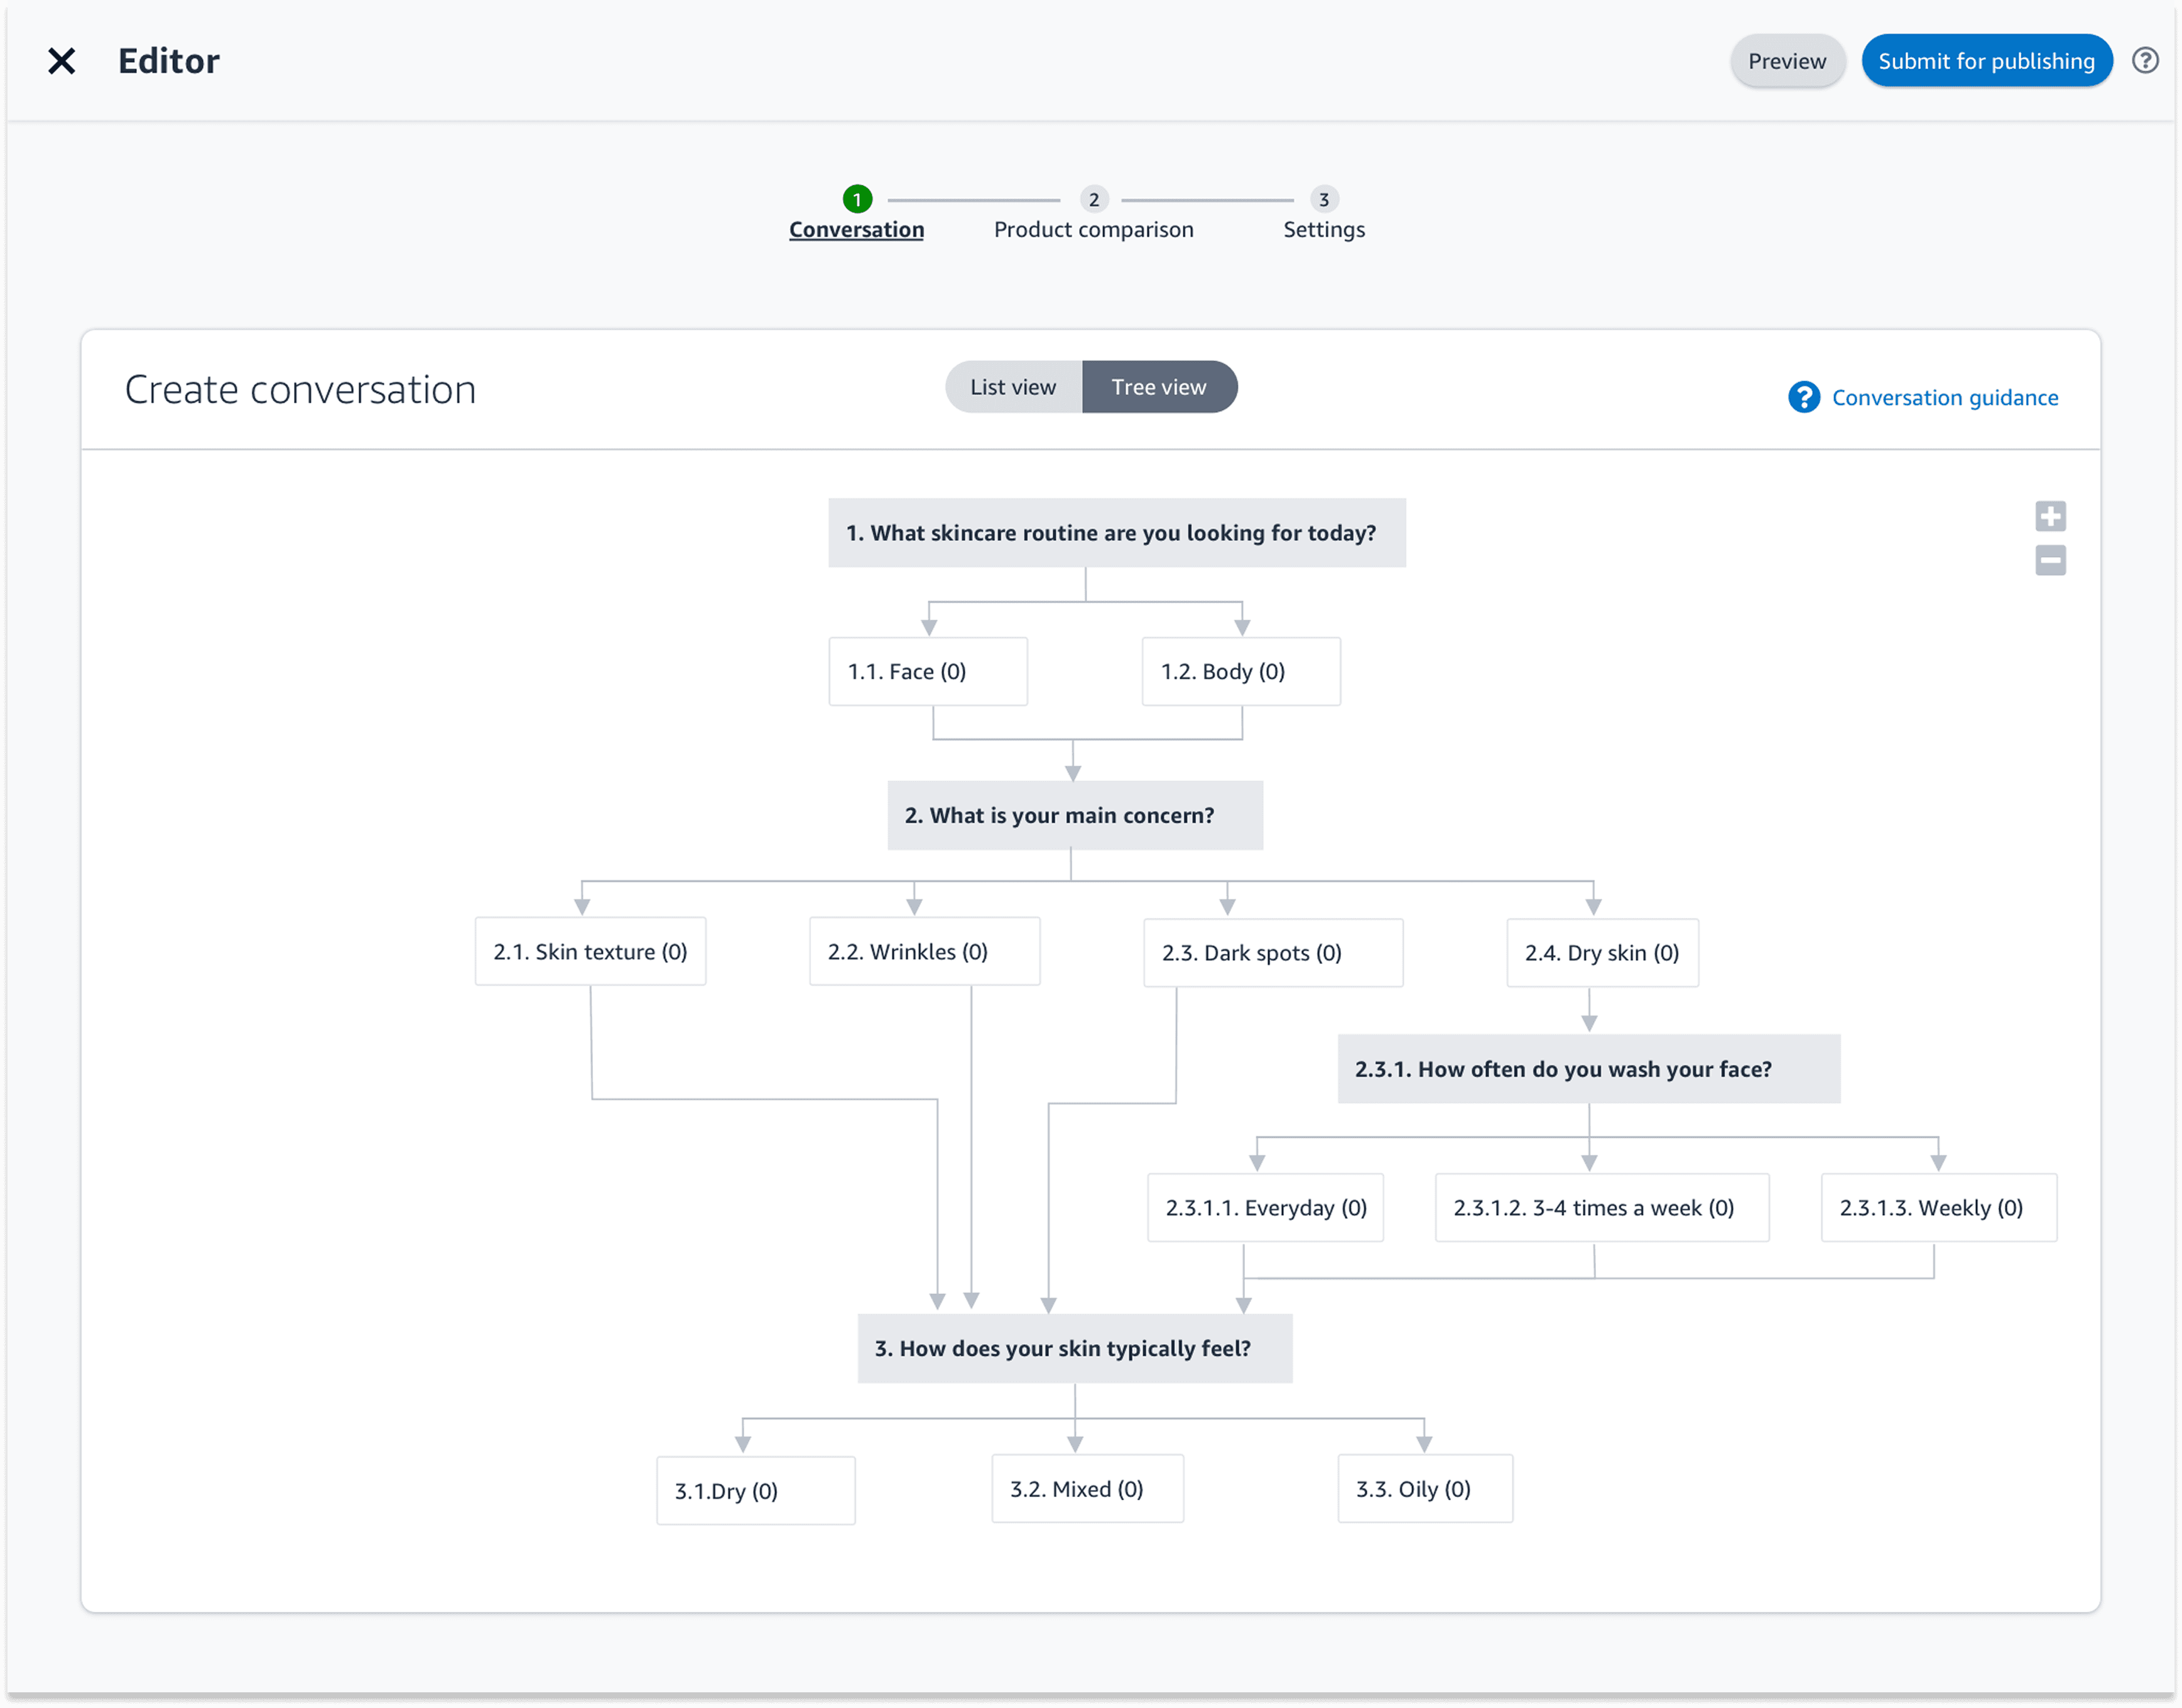
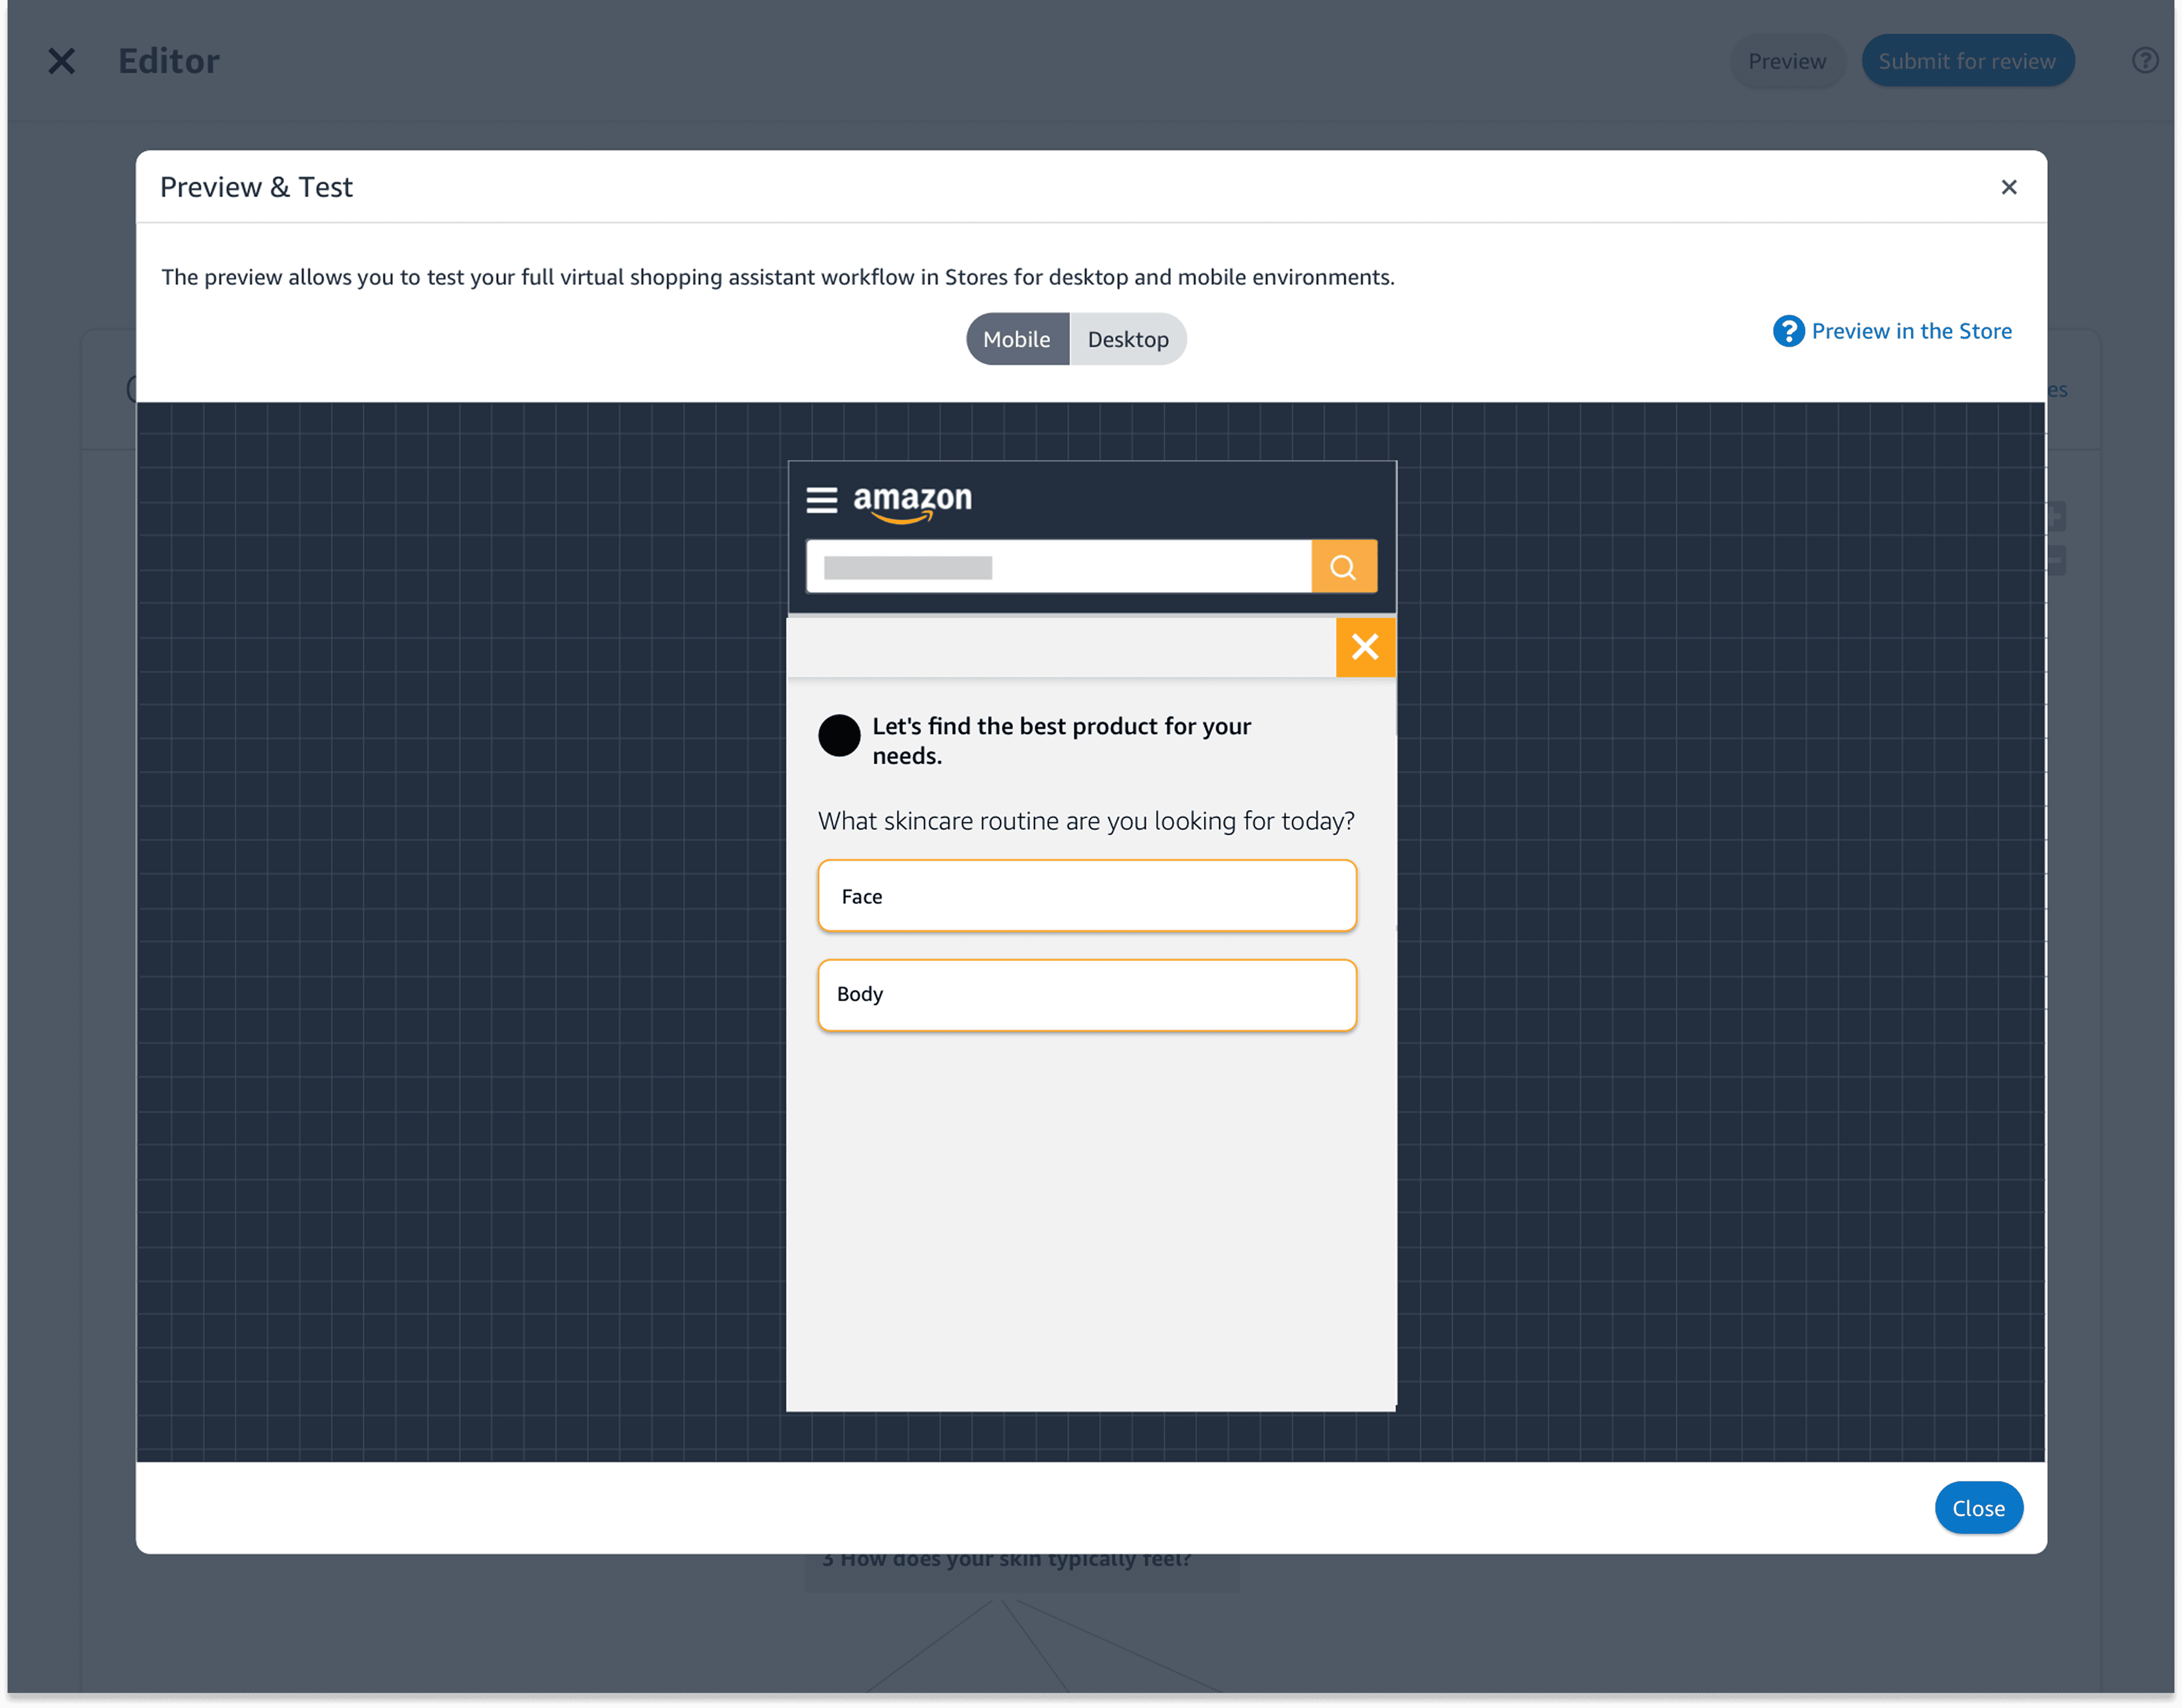
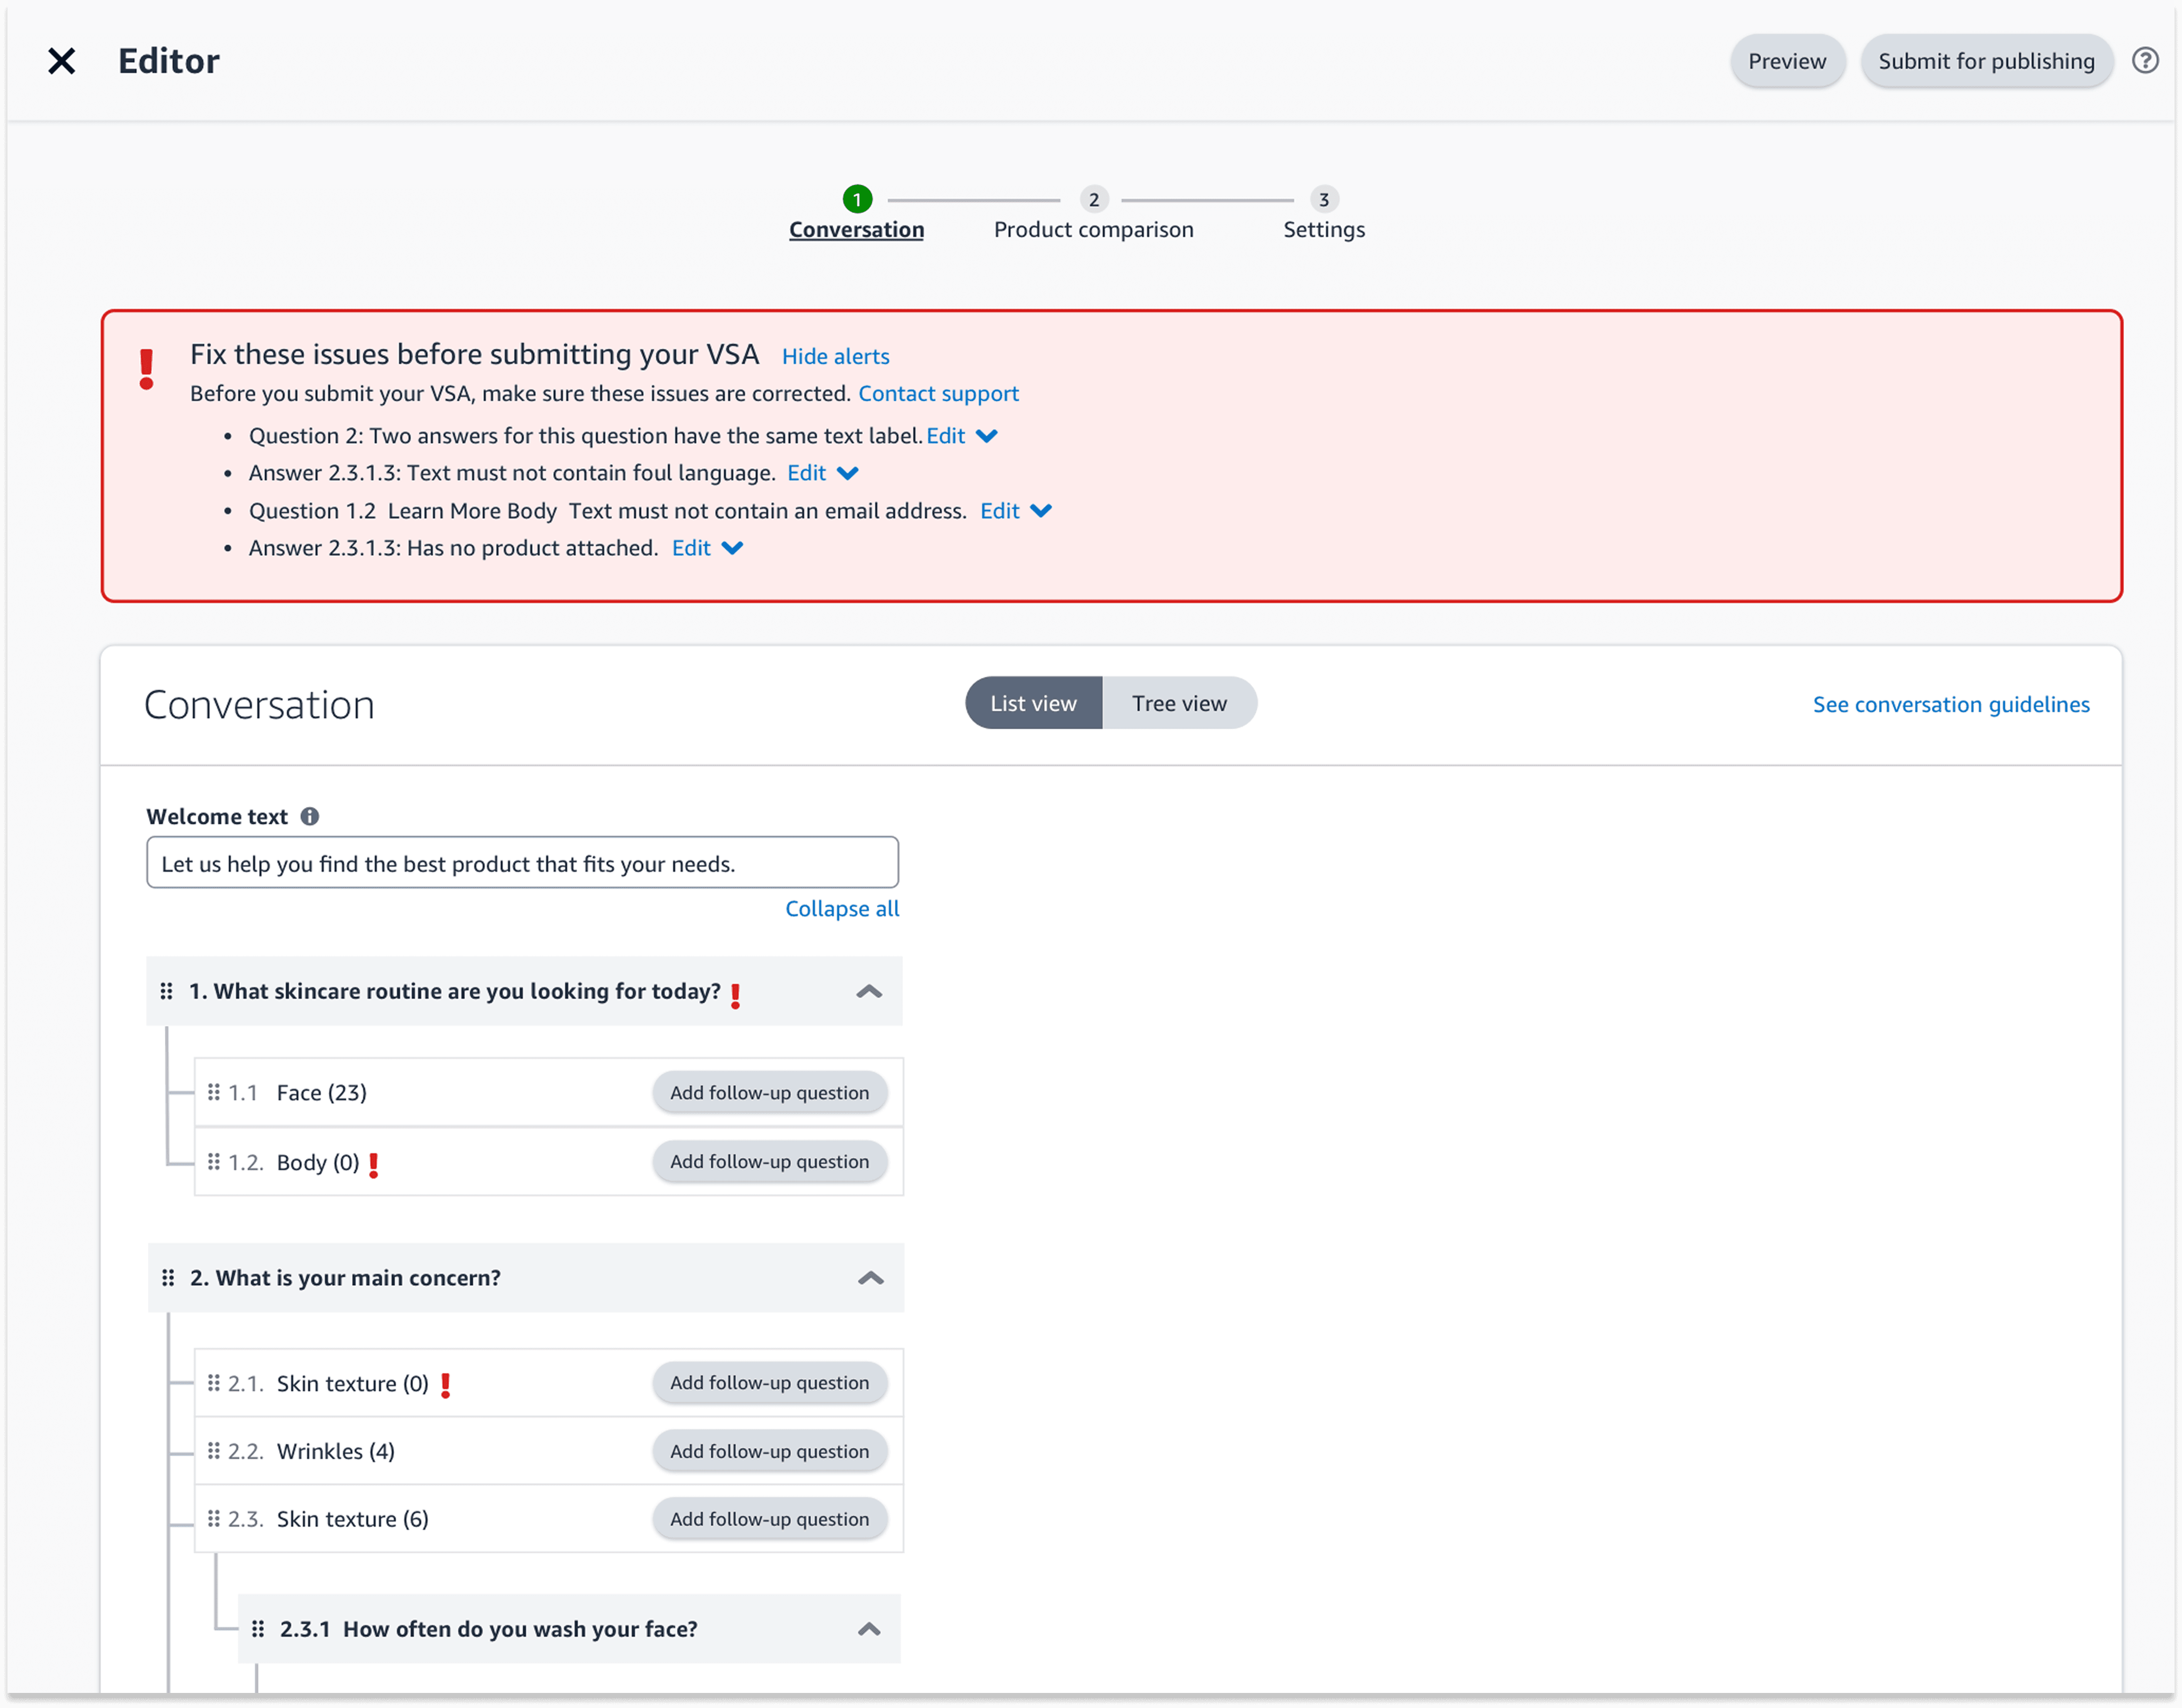
Wireframe
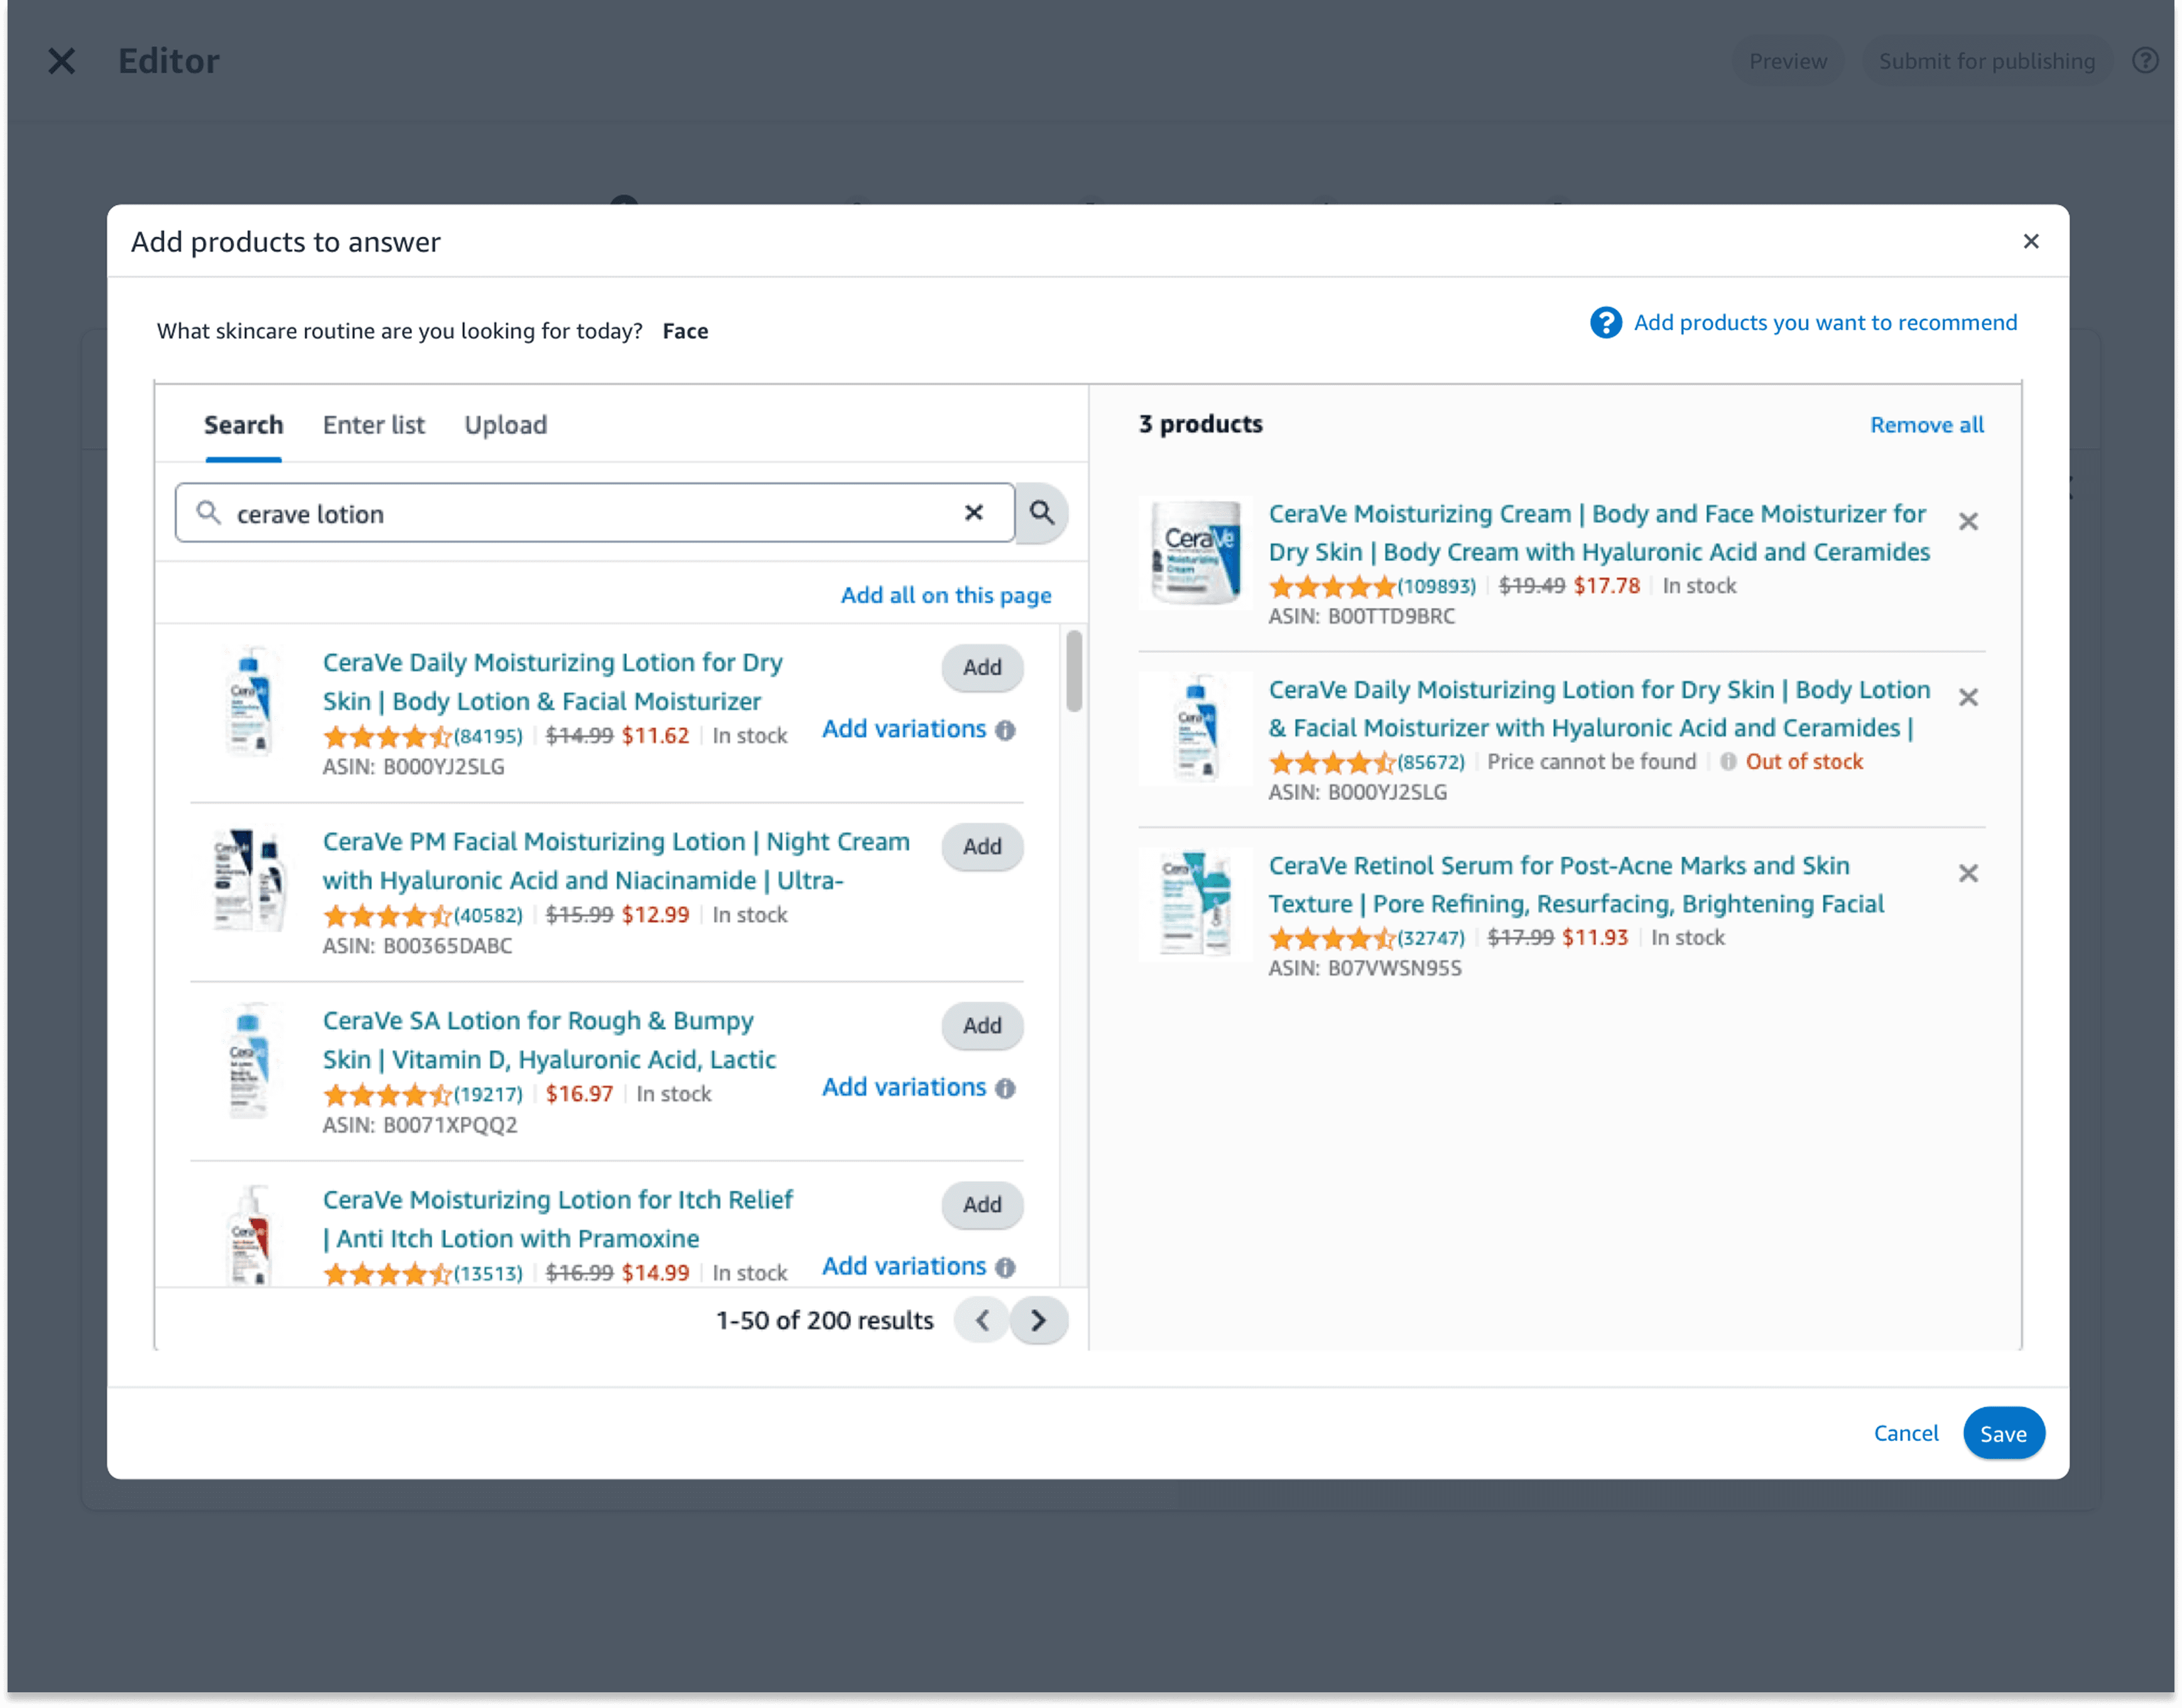
Guided Shopping Flow Builder: Drag-and-drop interface for creating question-and-answer modules that end shoppers will see.
Education Content Manager: Rich-text editor and video embed cards for product tutorials and best-practice tips.

Design Exploration
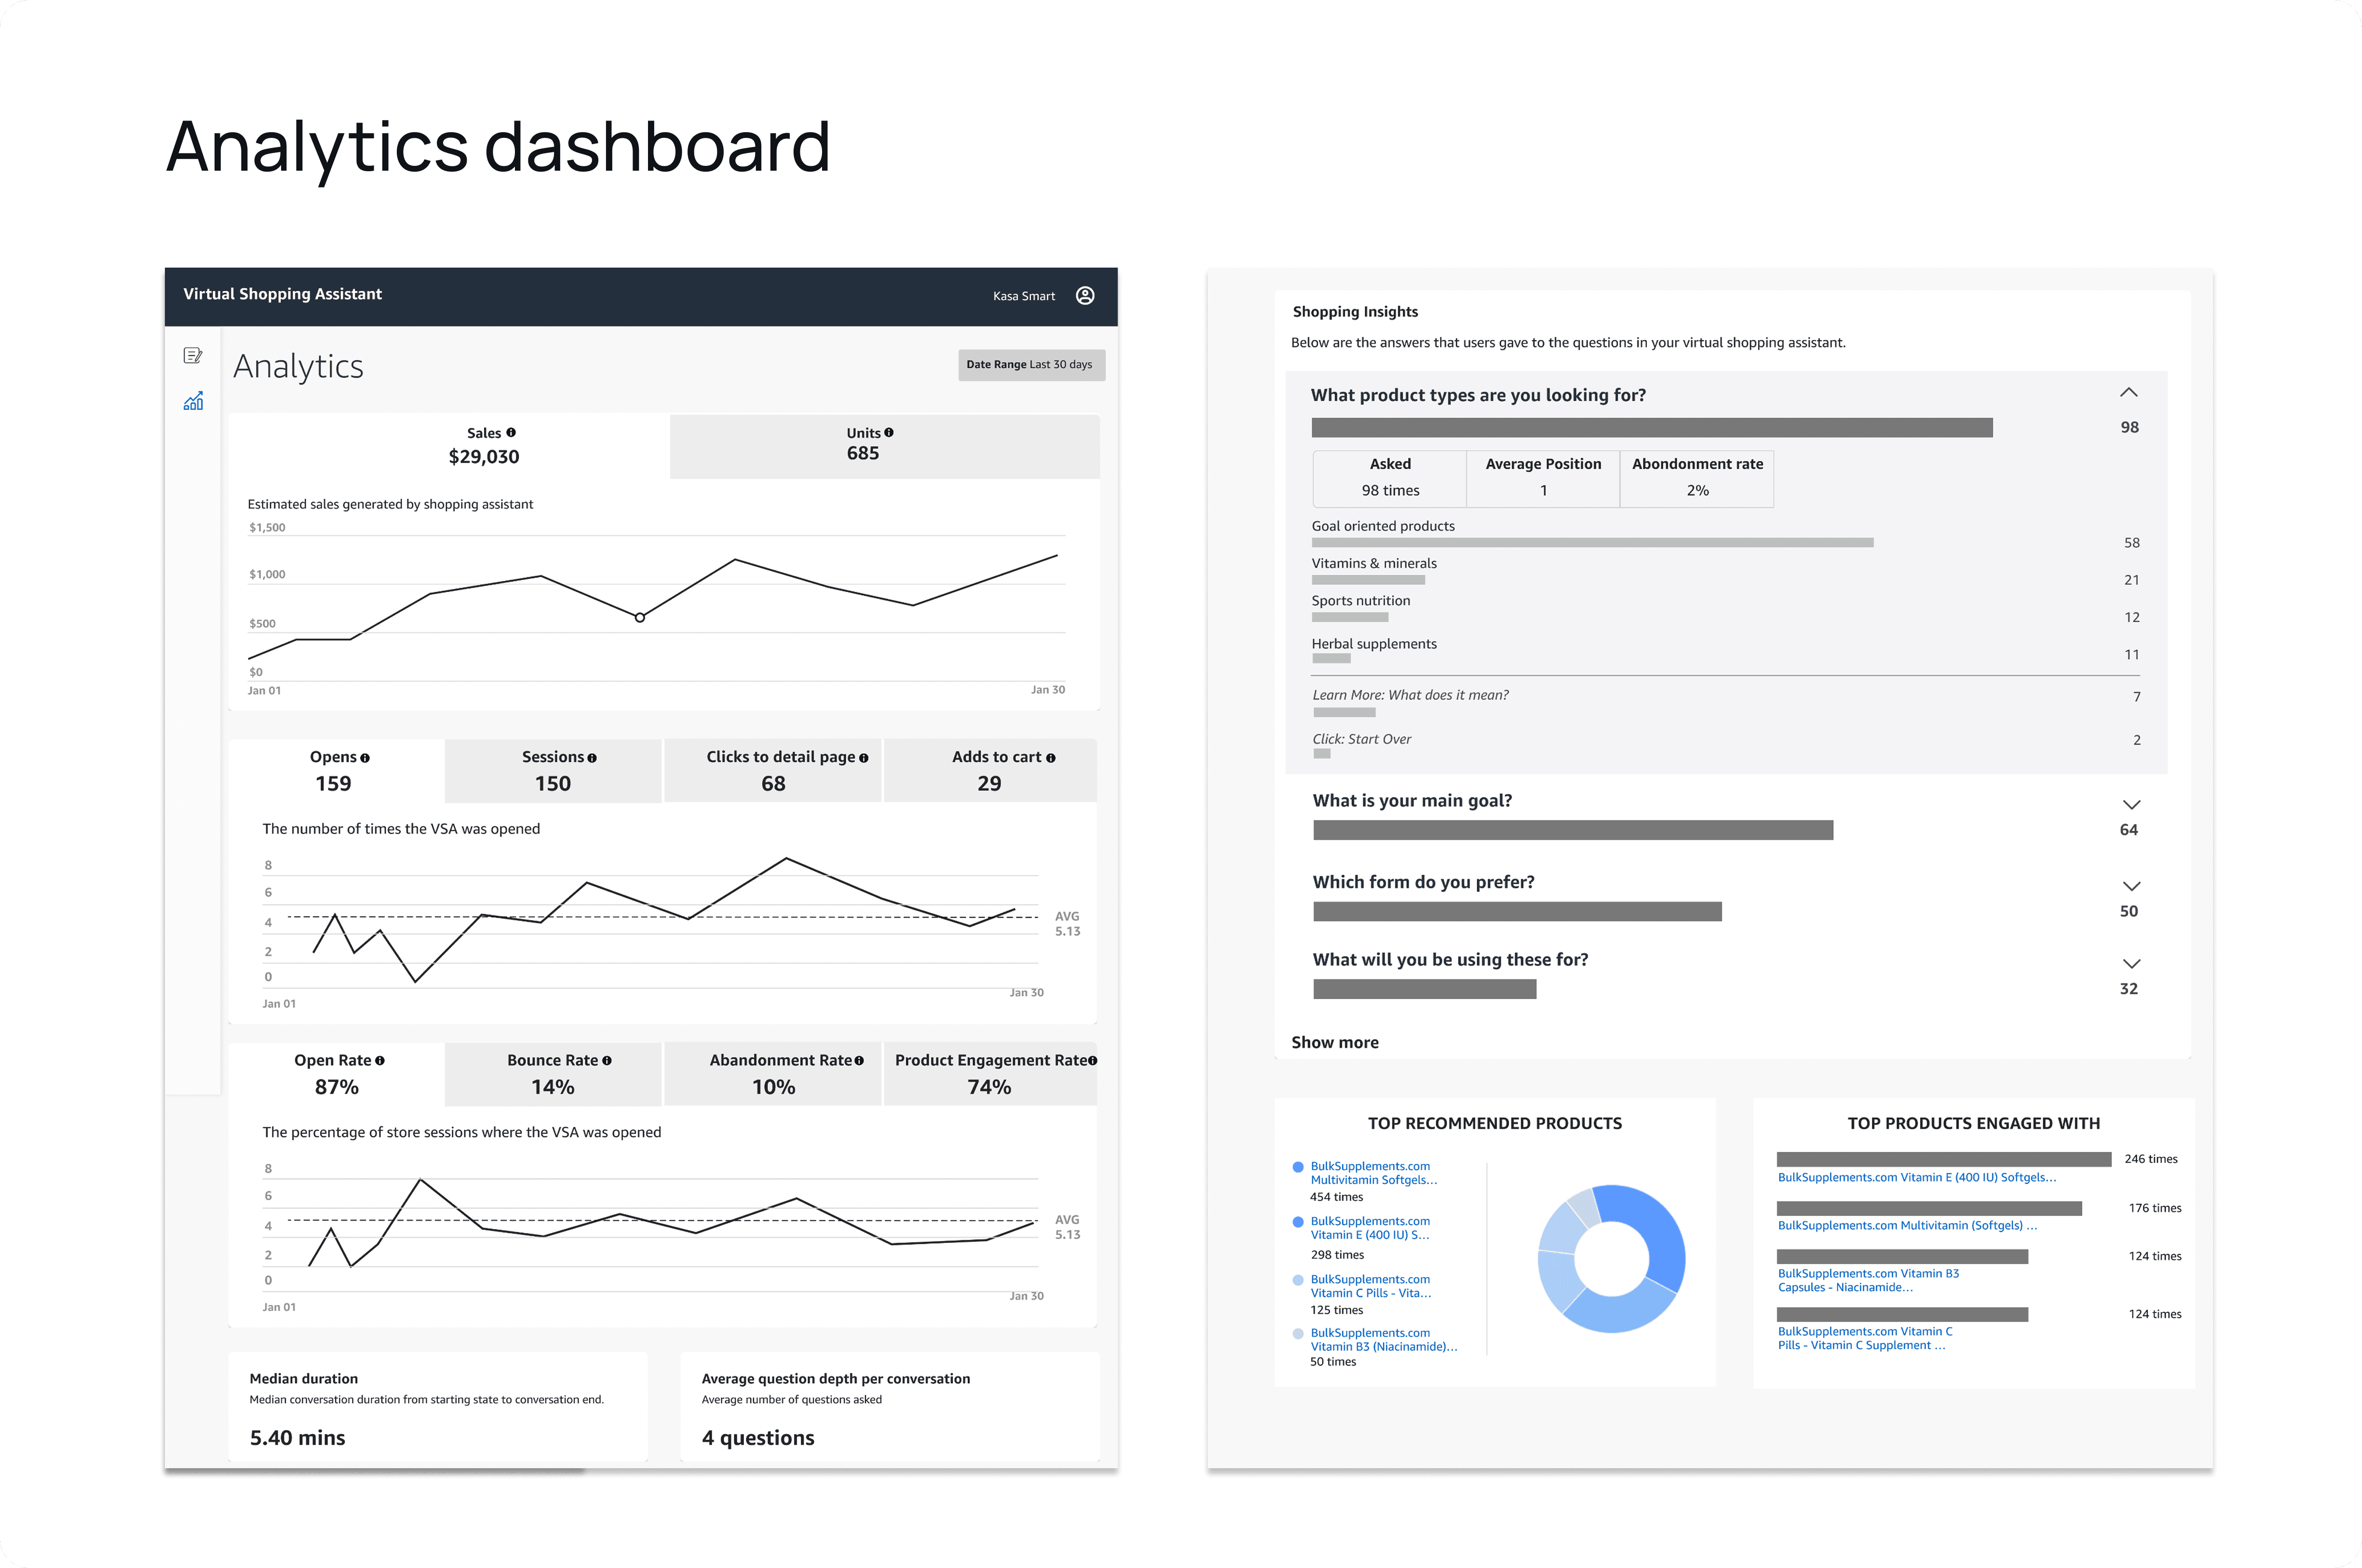
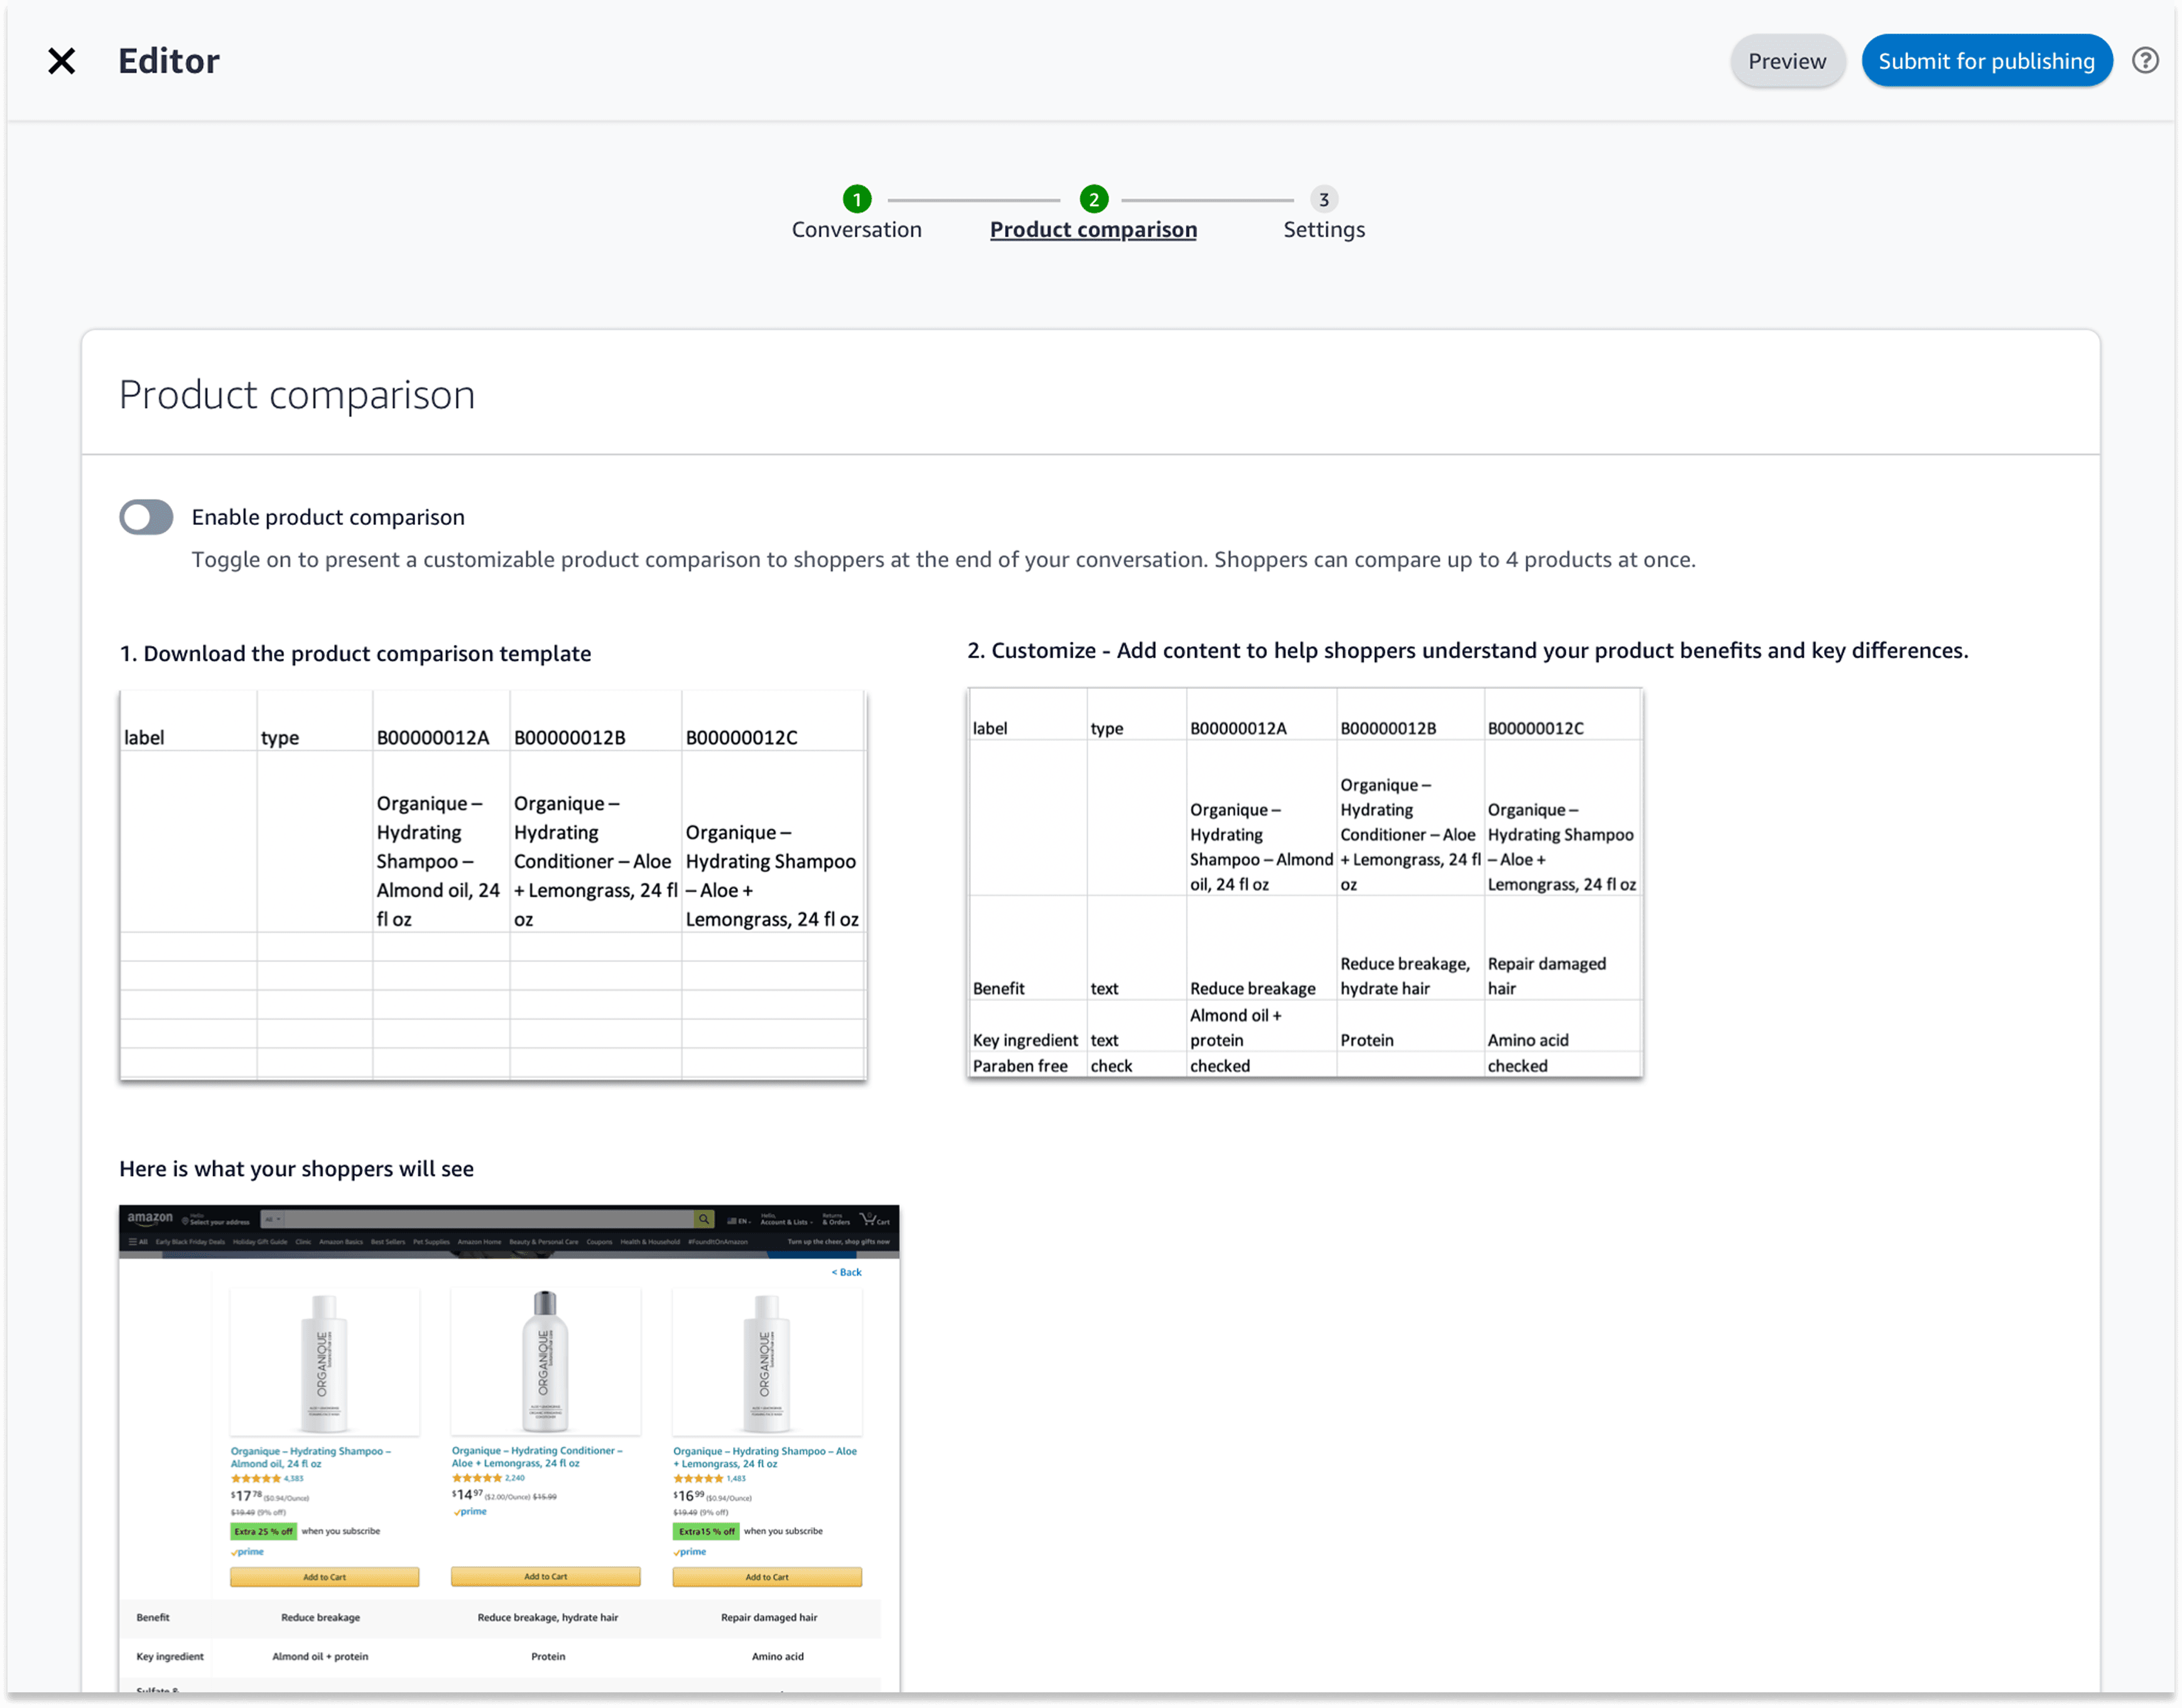
Dashboard Overview: At-a-glance KPIs (revenue, units sold, conversion rate) with time-range filters.
Product Performance Table: Sortable grid showing SKU-level sales, click-through rates, and margin.

Final Flow
Results
60% faster onboarding
Streamlined guided-flow builder and dashboard walkthroughs cut new-brand setup time by over half.124 brands in BETA
Rapid uptake in our pilot program, validating demand for a centralized Brand Console.375 brands on waitlist
Strong early interest underscores market appetite and positions us for a scalable launch.

Go Back

