Jarvis AI - Clinical Trials
Investor-focused dashboard that aggregates & scores industry-sponsored trials, surfacing a clear “probability of success” metric and key risk drivers—so biotech investors can zero in on high-opportunity assets in seconds.
Role
Product & Data Visulization Designer
Timeline
3 months
Platform
Web & Mobile

Project Overview
An investor-focused dashboard that aggregates industry-sponsored trials and computes a single “Probability of Success” score alongside key risk drivers. By combining smart filters and AI-powered summaries, due diligence time plunged from 20 minutes to 4 minutes—an 80 % efficiency gain that lets investors zero in on high-opportunity assets in seconds.

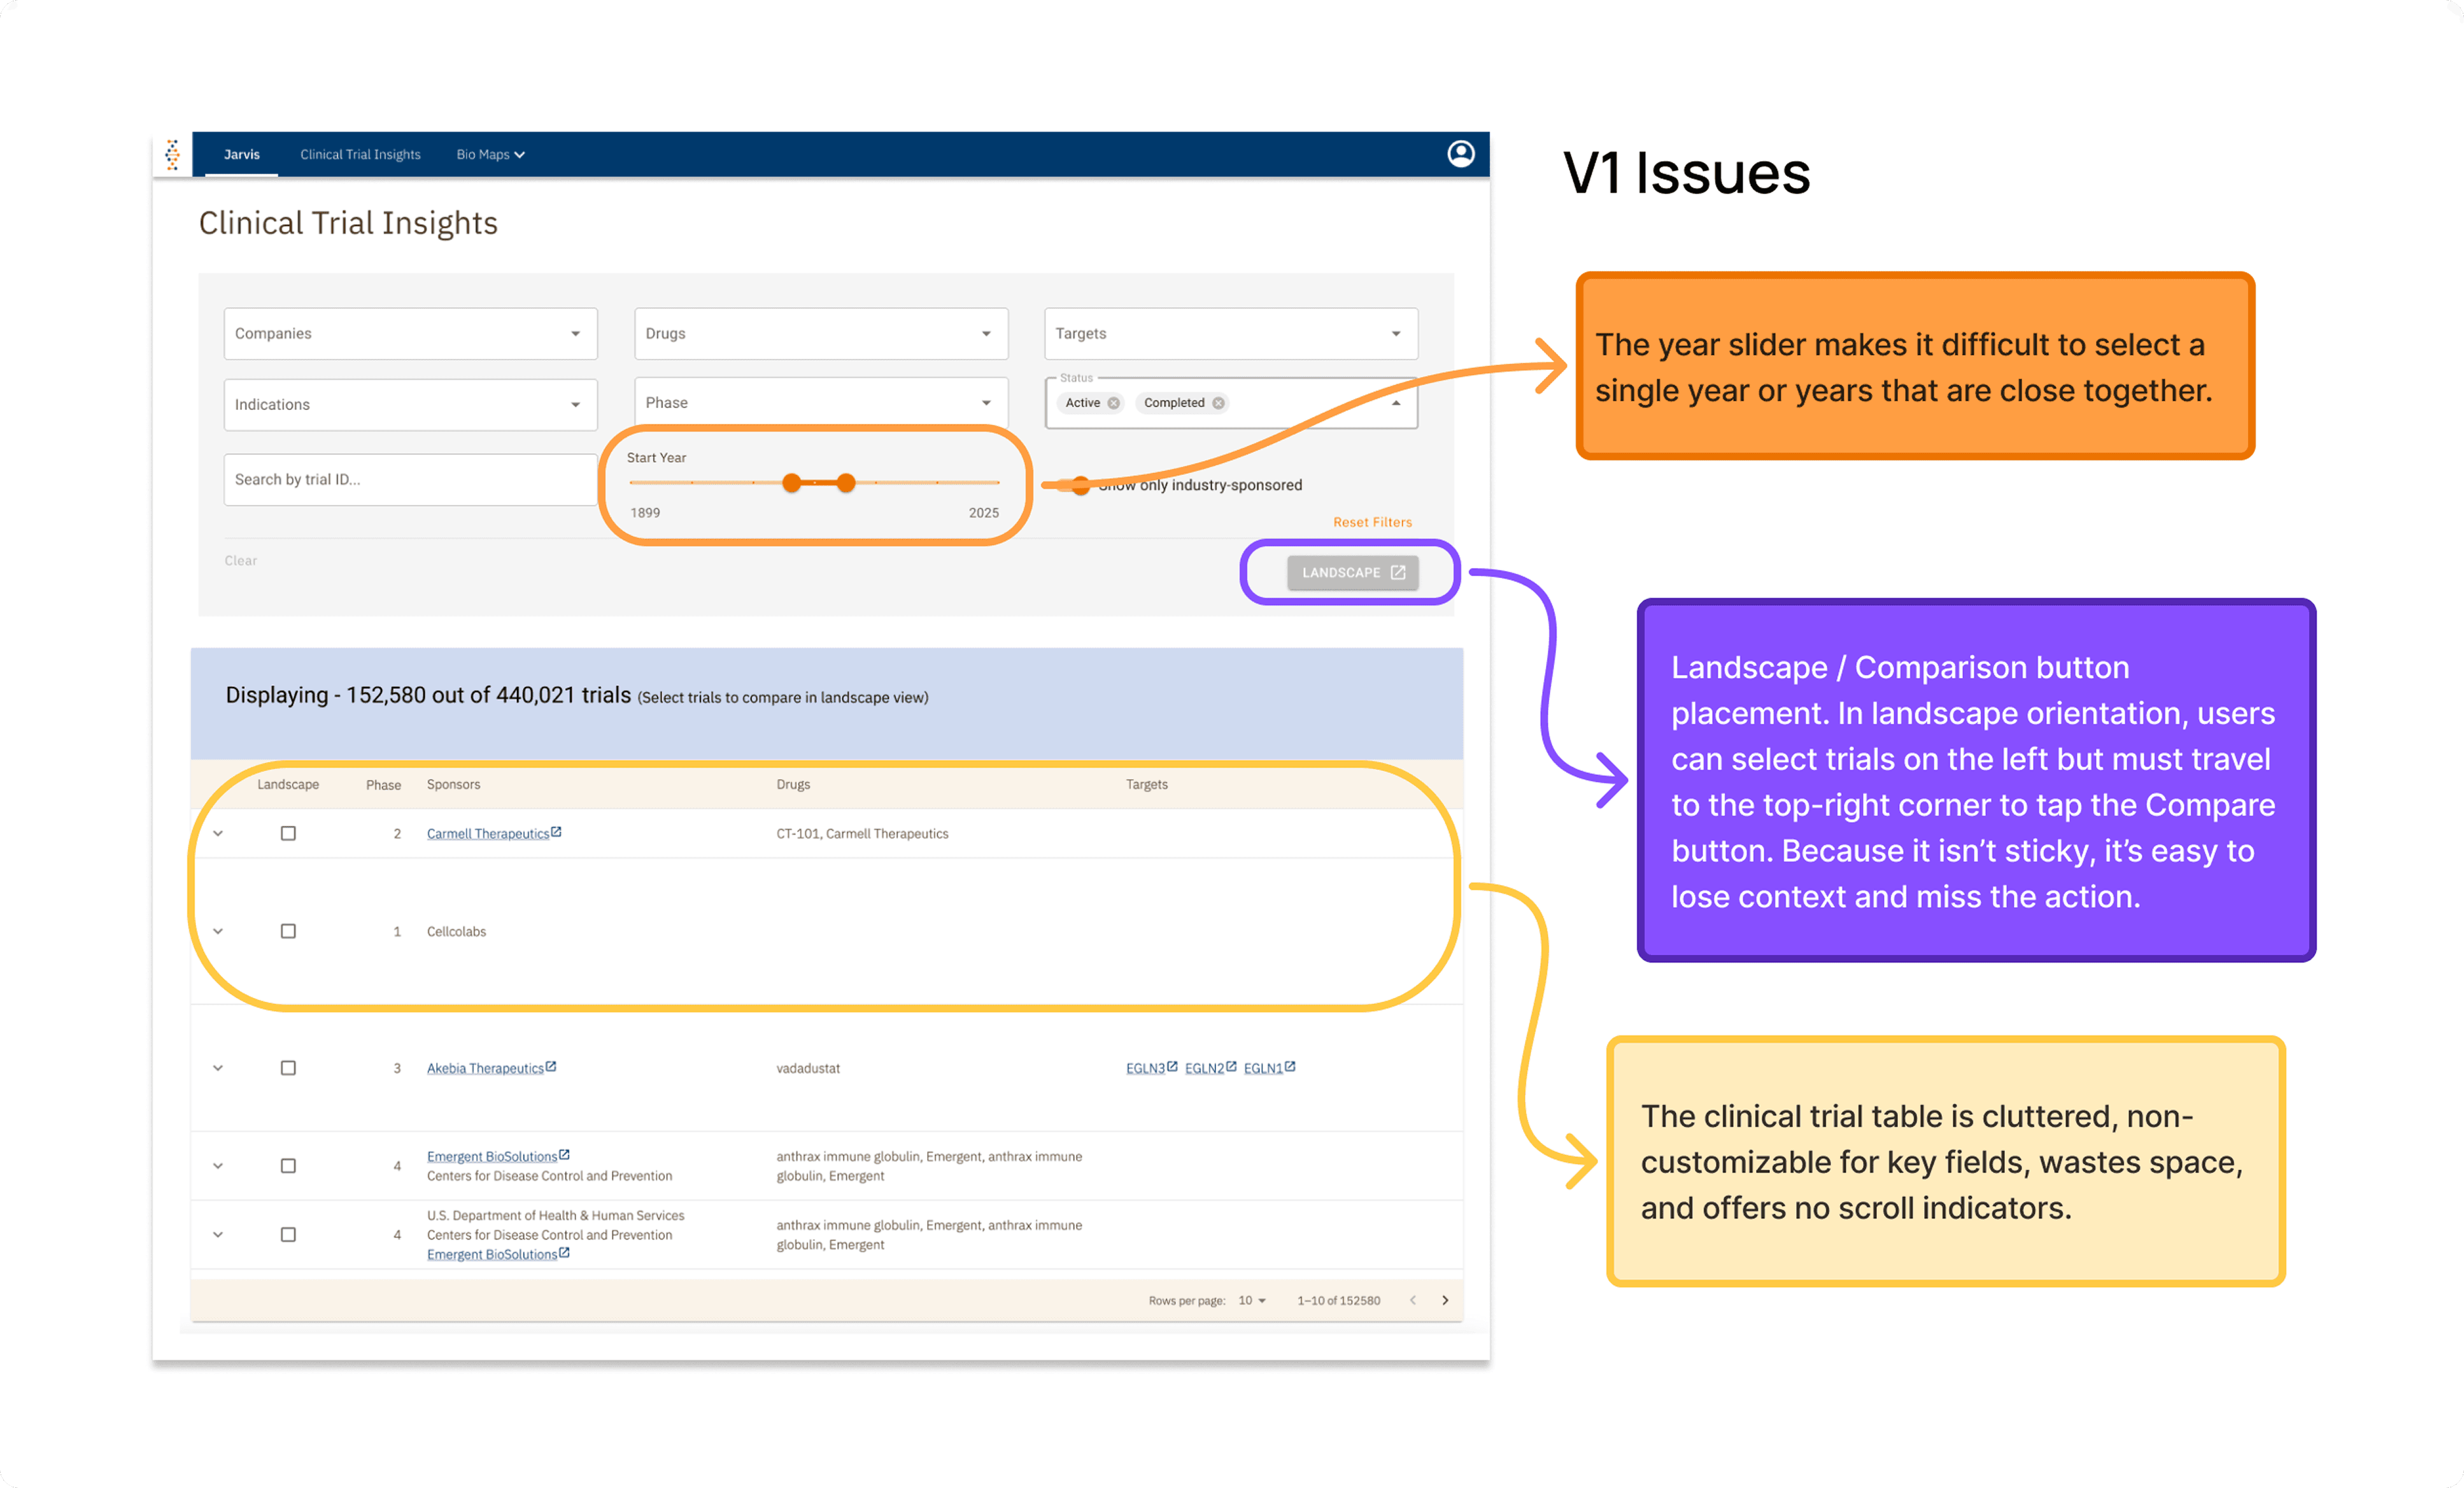
Problem
Fragmented data landscape
Investors scramble through ClinicalTrials.gov, PubMed, sponsor decks, FDA archives, spreadsheets and data rooms—wasting time and risking missed signals.Low trust & adoption
Fewer than 20 % of trials get re-evaluated. Junior analysts, overwhelmed by volume and noise, default to intuition—eroding confidence in decision-making.No unified risk metric
Manual review takes up to 20 minutes per trial, with subjective, inconsistent scoring and no benchmarking framework.Hidden insights in silent trials
70 % of completed trials report no public results—and no tool today makes fragmented data accessible, interpretable or actionable.

Goal
Cut gathering info time by ~50% (from 20 min to 10 min per trial).
Reduce volume of information to look at
Adapt trial success score : target 40% of analyst workflows leveraging the trial success score within 3 months.
Process

Personas
🧠 Analytical Alice
A senior investor who needs both a high-level summary score to assess risk at a glance and the ability to drill into detailed trial data when needed. She values efficiency, accuracy, and transparency to make informed decisions quickly.
⏱️ Scanner Sam
A time-pressed decision-maker—often a junior analyst or senior portfolio lead—who relies on visual cues like color-coded indicators and quick filters to flag high-priority trials. He doesn’t have time for deep research but needs to spot red flags fast.
🔬 Scientific Sue
A domain expert involved in drug development, medical affairs, or biotech investing. She validates trial design, endpoints, and methodology to ensure scientific rigor before committing capital or strategy. Accuracy and credibility are her top priorities.
Research
📊 Quantitative Findings
20 min average time-to-insight for trial evaluation, with high cognitive load and switching between multiple tools.
60% user drop-off before reaching detailed trial metadata—indicating friction in surfacing key signals early in the flow.
🗣️ Qualitative Insights
Streamline view: Remove low-value data (e.g. indication status) to cut clutter.
Filter clarity: Show active filters as removable pills for easy control.
Smart defaults: Surface recent completions by default—lightweight and non-intrusive.
Table priority: Enable horizontal scroll, but keep key columns up front.
Trial grouping: Cluster studies by drug to view related trials together.
📐 Industry Standards Review
We studied investor workflows against common tools used in the industry—such as ClinicalTrials.gov, internal spreadsheets, and expert calls—and found:
Lack of standardized metrics to assess trial success likelihood.
High dependency on manual curation and individual judgment.
Competitive Landscape
Competitor | Strengths | Gaps vs. Jarvis |
|---|---|---|
Clinicaltrials.gov | Public | 70% completed trials has no results but Jarvis can analyze PubMed abstracts can guess trial results (Outcome pills) |
Noah.ai | Clean UI, chat assist | Limited trial coverage; no explainable score or abstracts |
Biomni | Agent support but can't compare | Comparison and ability to reach scores. |
Jarvis advantage: Custom “Probability of Success” score, explainability hover-states, plus one-click drill into endpoints & enrollment.

Design Exploration
In our interviews, investors told us they want a clean, scannable overview of trials—with the ability to dive into details without losing context. Option 3 delivers exactly that:
Lean, High-Value Table
Columns limited to Company, Drug, Status/Phase, Indication, and Target—data investors check first.
“Compare” remains sticky in the top-right for instant side-by-side analysis.
Persistent Side-Detail Panel
Clicking any row opens a scrollable, right-hand panel containing full protocol, endpoints, results, and outcomes.
The table stays fully visible, so you can toggle between trials without back-and-forth.
On desktop, the panel sits alongside the table; on mobile, it collapses into a swipeable modal.
Why It Works
Context Retention: Users never lose their place in the list.
Speed & Focus: The lean table surface accelerates scanning; the panel supports deep dives only when needed.
Customizability: A column-picker lets each investor surface exactly the five fields they care about most.


Final Design
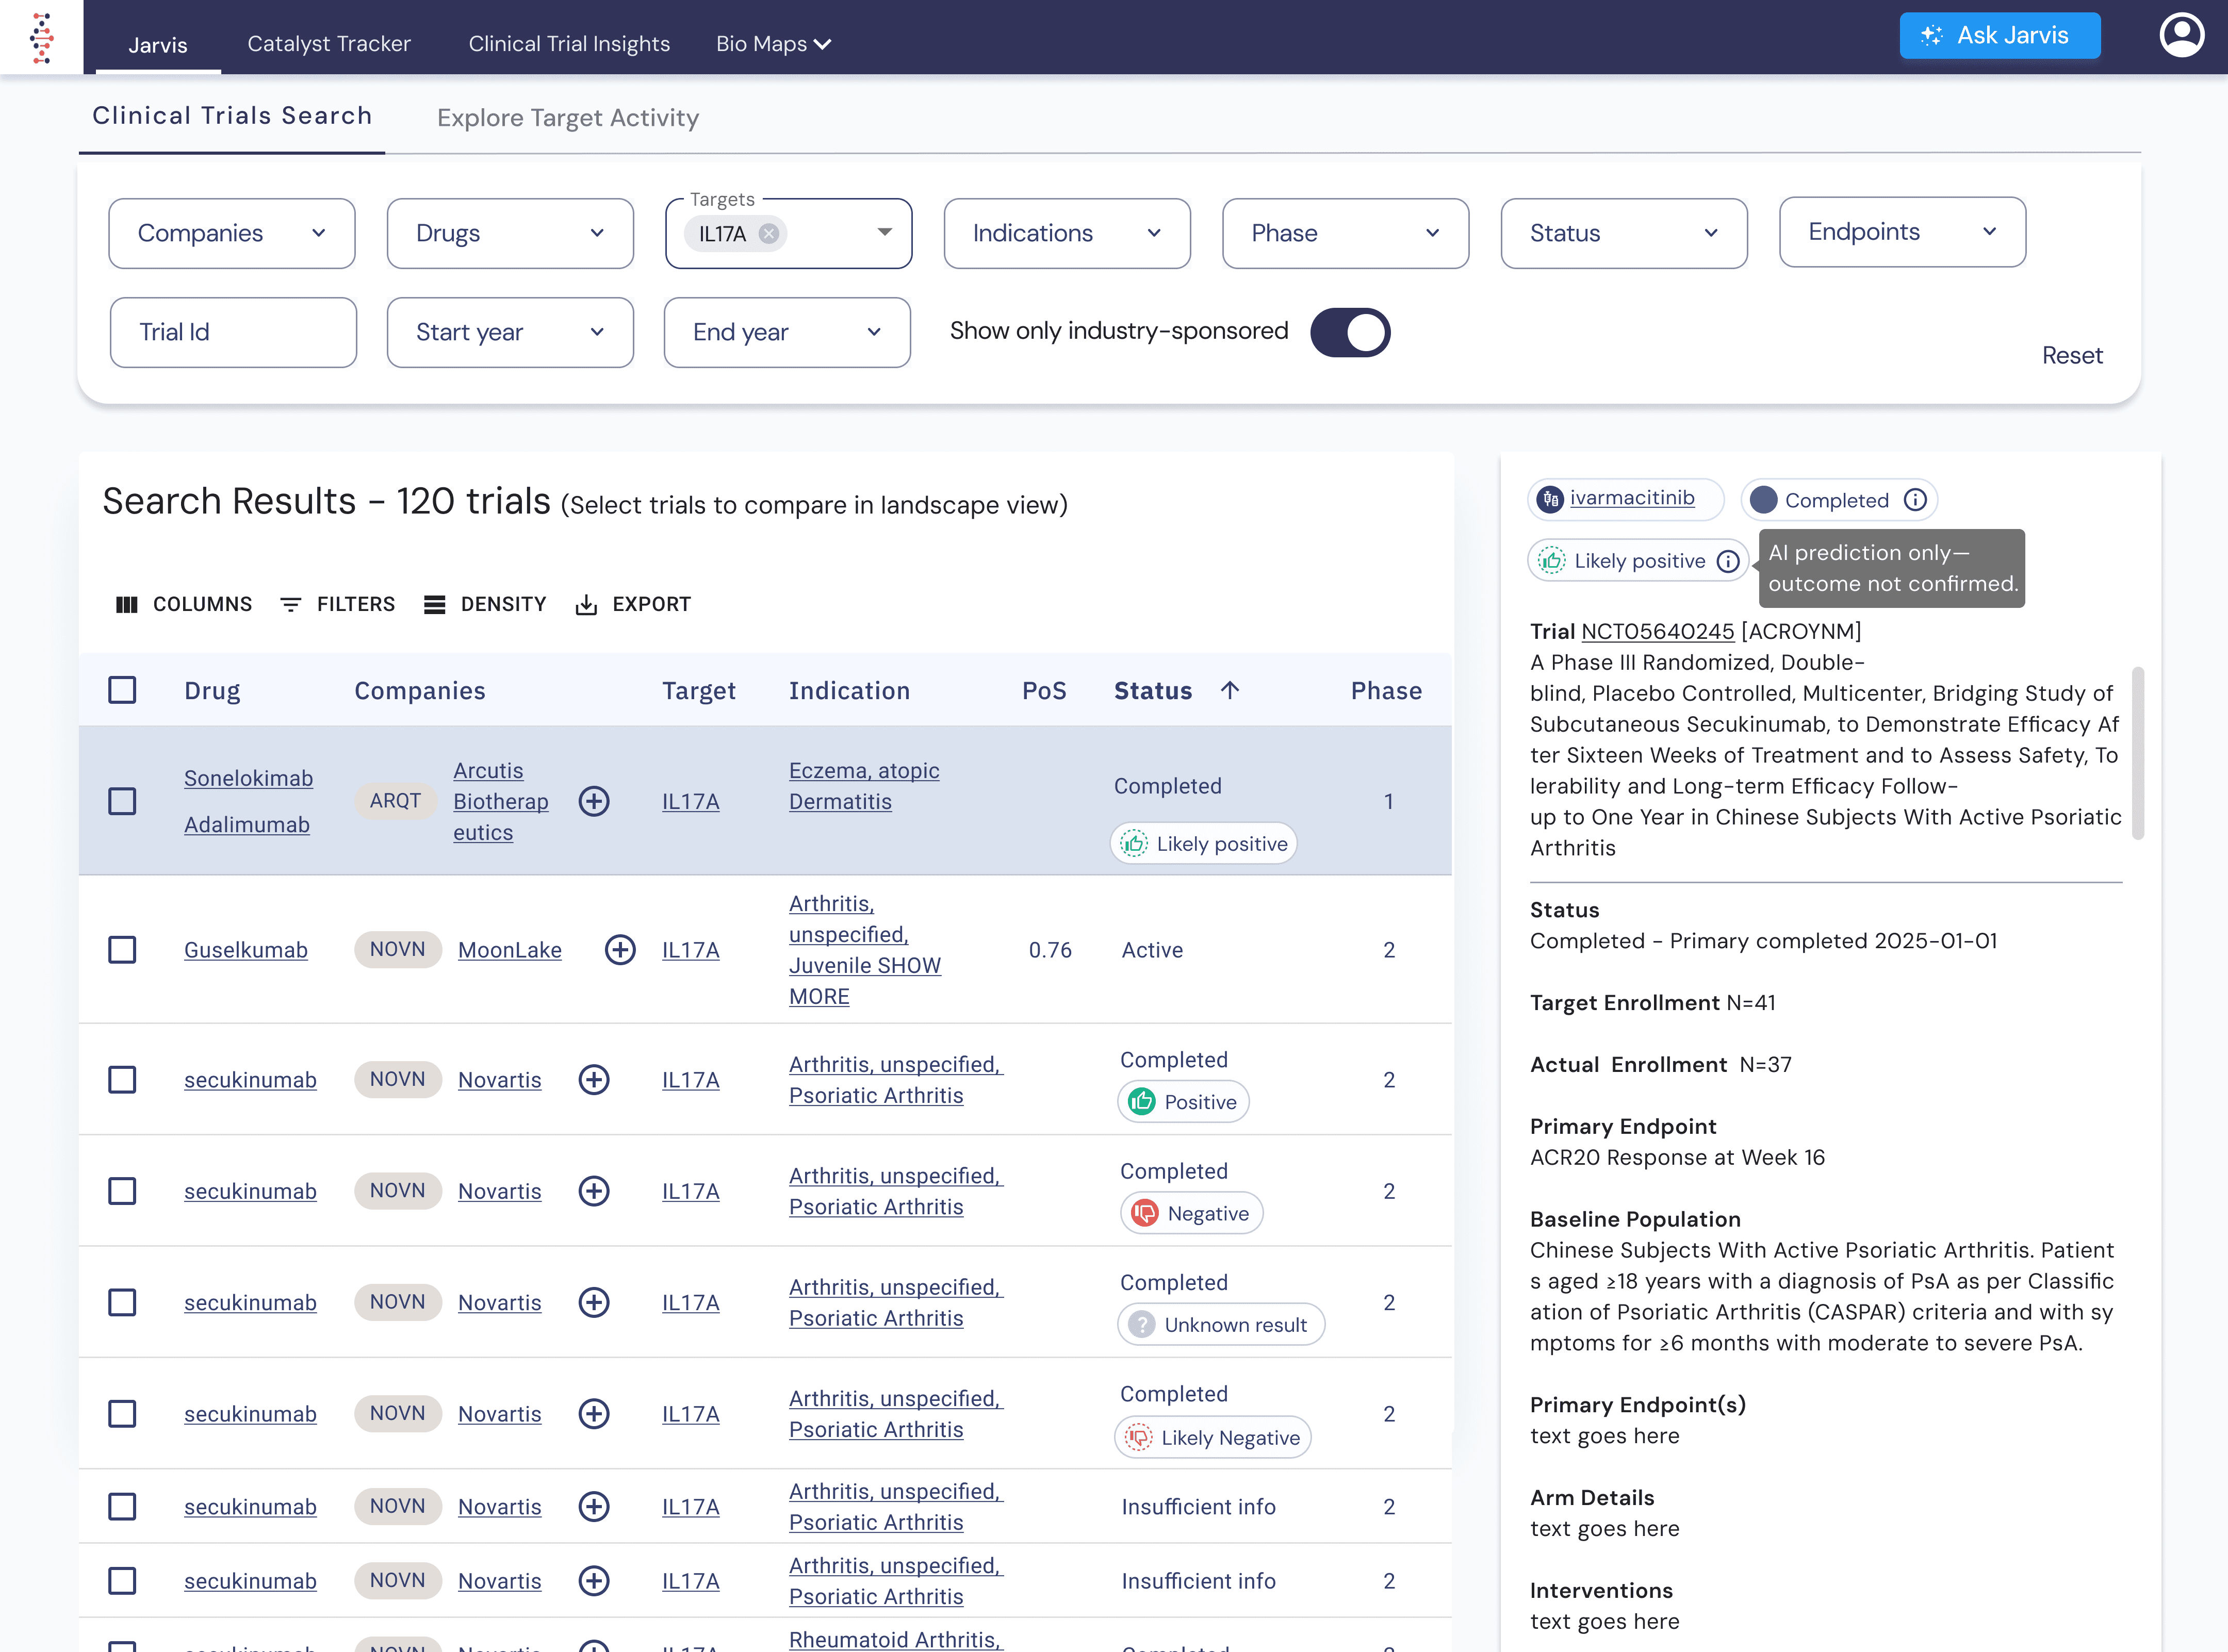
Solution
I crafted an investor-focused trial UX that pairs a clear “Probability of Success” score with on-demand, explainable detail—so users can move from high-level triage to deep dive in seconds. Personalization, smart defaults, and AI-driven insights underscore every interaction.
Key Features
PoS Badge: Color-coded success score in the table for instant triage
Expandable Panel: Slide-in view with full trial metadata, PoS breakdown, and risk drivers
AI Search: Ask natural-language queries (e.g. “Phase 2 oncology trials with low enrollment”) to surface relevant studies
Smart Filters: Dynamic controls (company, drug, phase, endpoint, sponsor) for real-time result customization
Export: One-click CSV download for offline analysis and sharing

Results
🕒 80% reduction in diligence time
Trial review time dropped from 20 minutes to just 4 minutes—driven by integrated PoS scoring, smart filters, and AI-powered summaries.
📈 45% adoption rate within pilot
Nearly half of the 12-person pilot group incorporated the tool into their daily workflow within the first 3 weeks.
✅ +18% increase in trust
Pre- and post-pilot surveys showed an 18% boost in analyst trust toward AI-generated scores, driven by score explainability and transparency.

Go Back

